European Meteor Monitoring and the EDMOND Database
Through extensive international collaboration, meteor activity is now monitored across nearly all of Europe. This cooperation has led to the accumulation of substantial observational data. As of the latest update, the EDMOND database (European viDeoMeteOr Network Database) encompasses 8,938,668 individual meteor records collected between 2000 and 2024. Among these, 967,702 multi-station detections have been used to compute initial "Q0" orbits. The most recent release, version 6.01 (May 2025), includes 628,271 refined orbits derived from observations between 2001 and 2024.
The database contains data from the following national and international networks (in alphabetical order): BOAM (Base des Observateurs Amateurs de Metéores, France, 2010-2020, UFOCapture); BosNet (Bosnian Network, Bosnia and Herzegovina, 2012-2014, UFOCapture); BRAMON (BRAzilian MeteOr Network, Brazil, 2014-2017, UFOCapture); CEMeNt (Central European Meteor Network, Czechia and Slovakia, 2009-TP, UFOCapture); CMN (Croatian Meteor Network or Hrvatska Meteorska Mreza, Croatia, 2007-2011, own software); CSMON (Czech and Slovak Meteor Observation Network, Czechia and Slovakia, 2019-TP, RMS); FMA (Fachgruppe Meteorastronomie, Switzerland, 2014-TP, UFOCapture); HMN (Hungary Meteor Network or Magyar Hullócsillagok Egyesulet, Hungary, 2009-TP, MetRec and UFOCapture); IMO VMN (IMO Video Meteor Network, worldwide, 2000-2019, MetRec); ITMN (Italian Meteor and TLE Network, Italy, 2007-2017, UFOCapture); MeteorsUA (Група відеоспостереження метеорів, Ukraine, 2013-TP, UFOCapture); NEMETODE (Network for Meteor Triangulation and Orbit Determination, Great Britain, 2010-2020, UFOCapture); PFN (Polish Fireball Network Pracownia Komet i Meteorów, Poland, 2011-2013, UFOCapture); Stjerneskud (Denmark, 2012-2016, own software); SVMN (Slovak Video Meteor Network, Slovakia, 2007-2016, UFOCapture); UKMON (UK Meteor Observation Network, Great Britain, 2012-2022, UFOCapture) and independent observers.
Orbit calculations within EDMOND are performed using UFOOrbit v2.63, a tool compatible with data in the UFO format. Data obtained via MetRec software require conversion to this format using SonotaCo's INF2MCSV utility. In UFOOrbit v2.63, meteor pairs observed within a time interval of less than 5 seconds are flagged as Q0 orbits, provided they meet specific criteria outlined in the UFOOrbit Manual (Kornoš et al. 2013):
| Name and designation of the criterion | Unit | Q0 Limitation | EDMOND Limitation |
|---|---|---|---|
| minimal meteor duration | s | dur ≥ 0.06 | 0.10 |
| minimal initial speed | km/s | v₀ > 5 | 5 |
| minimal overlap of sightings | % | Gm > -100 | -100 |
| minimal observed trajectory angle | deg | Q₀ > - | 1.0 |
| minimal convergence angle | deg | Qc > - | 5.0 |
| maximal pole-pole distance | deg | dGP < - | 1.5 |
| maximal velocity difference | km/s | dV < 20 | 7 |
| maximal beginning height | km | H₁ < 180 | 180 |
| minimal beginning height | km | H₁ > 60 | 60 |
| maximal terminal height | km | H₂ < 150 | 150 |
| minimal empirical quality parameter [0–1] | - | QA > 0.05 | 0.15 |
Some criteria have been changed compared to the previous version (EDMOND v5.05) based on a detailed analysis of the database. The biggest change is the application of some criteria already when creating the so-called "Q0" orbits. The aim was to eliminate non-existent orbits already at this stage compared to previous versions of the database.
| YEAR | Q0 ORBITS METEORS | Q0 ORBITS ORBITS | EDMOND METEORS | EDMOND ORBITS | STAT/ORB | EDM/Q0 (%) |
|---|---|---|---|---|---|---|
| 2000 | 4,290 | 0 | 3,280 | 0 | - | - |
| 2001 | 25,470 | 354 | 19,934 | 248 | 2.097 | 70.06 |
| 2002 | 20,604 | 97 | 15,643 | 75 | 2.000 | 77.32 |
| 2003 | 31,555 | 176 | 23,554 | 121 | 2.083 | 68.75 |
| 2004 | 23,090 | 46 | 17,601 | 36 | 2.111 | 78.26 |
| 2005 | 36,215 | 114 | 27,717 | 81 | 2.000 | 71.05 |
| 2006 | 63,814 | 954 | 49,454 | 510 | 2.027 | 53.46 |
| 2007 | 92,338 | 3,652 | 73,518 | 2,315 | 2.089 | 63.39 |
| 2008 | 163,810 | 7,821 | 135,338 | 5,344 | 2.210 | 68.33 |
| 2009 | 230,196 | 13,076 | 191,331 | 7,911 | 2.223 | 60.50 |
| 2010 | 361,335 | 29,421 | 302,367 | 19,049 | 2.434 | 64.75 |
| 2011 | 539,021 | 55,146 | 431,038 | 36,110 | 2.461 | 65.48 |
| 2012 | 425,783 | 52,207 | 337,053 | 33,872 | 2.496 | 64.88 |
| 2013 | 507,321 | 62,066 | 401,272 | 41,270 | 2.535 | 66.49 |
| 2014 | 593,851 | 72,182 | 467,176 | 46,563 | 2.401 | 64.51 |
| 2015 | 804,846 | 101,469 | 631,781 | 66,396 | 2.565 | 65.43 |
| 2016 | 884,910 | 111,872 | 687,039 | 72,009 | 2.570 | 64.37 |
| 2017 | 751,031 | 94,988 | 579,854 | 59,055 | 2.594 | 62.17 |
| 2018 | 717,886 | 93,310 | 558,483 | 60,020 | 2.622 | 64.32 |
| 2019 | 878,793 | 94,537 | 697,040 | 61,235 | 2.475 | 64.77 |
| 2020 | 553,514 | 58,697 | 426,196 | 39,710 | 2.500 | 67.65 |
| 2021 | 278,521 | 29,127 | 217,037 | 18,129 | 2.479 | 62.24 |
| 2022 | 385,873 | 30,155 | 300,445 | 19,708 | 2.432 | 65.36 |
| 2023 | 425,224 | 35,545 | 356,674 | 24,991 | 2.682 | 70.31 |
| 2024 | 139,377 | 20,690 | 112,826 | 13,513 | 2.928 | 65.31 |
| TOTAL | 8,938,668 | 967,702 | 7,063,651 | 628,271 | 2.529 | 64.92 |
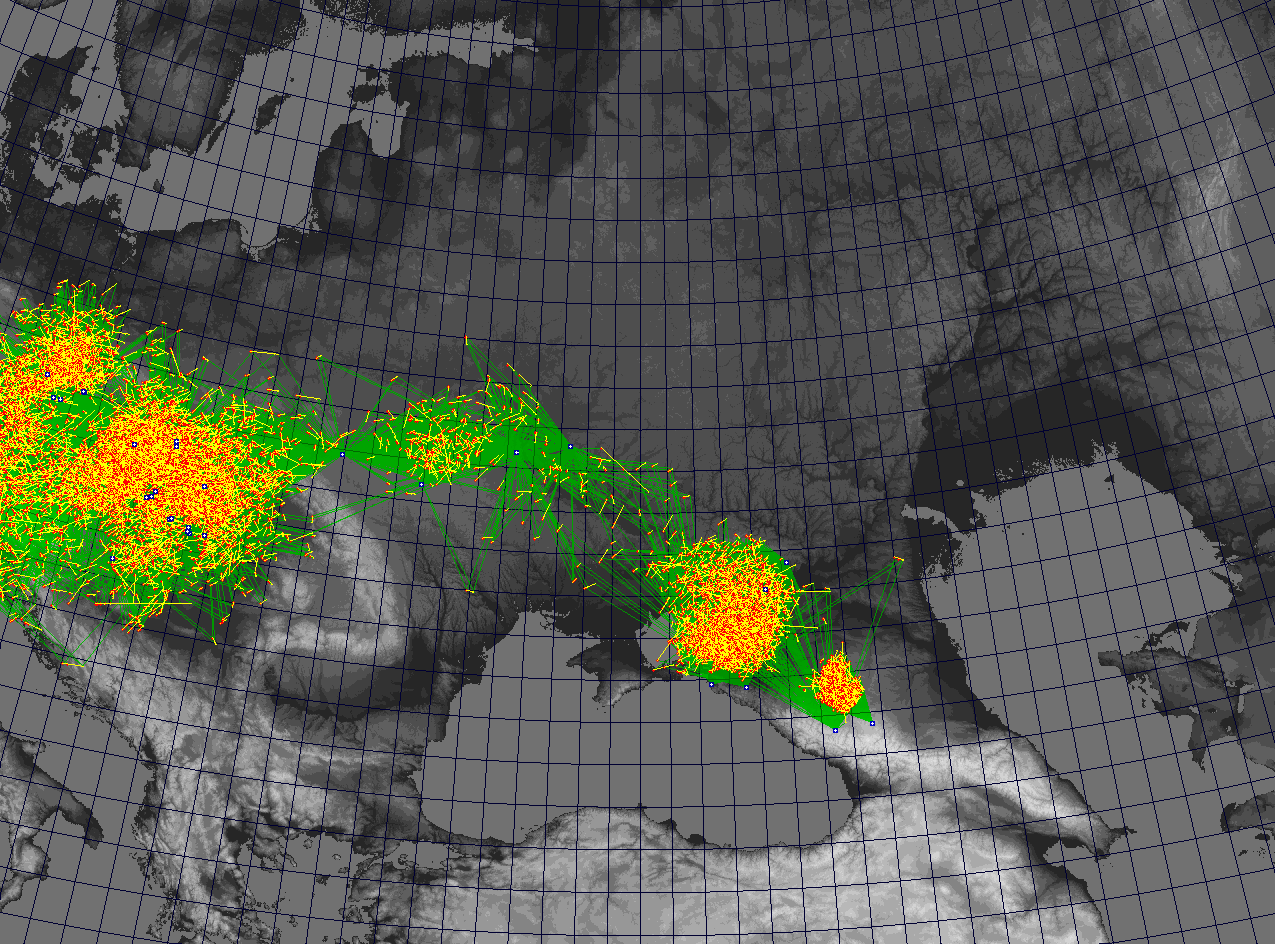
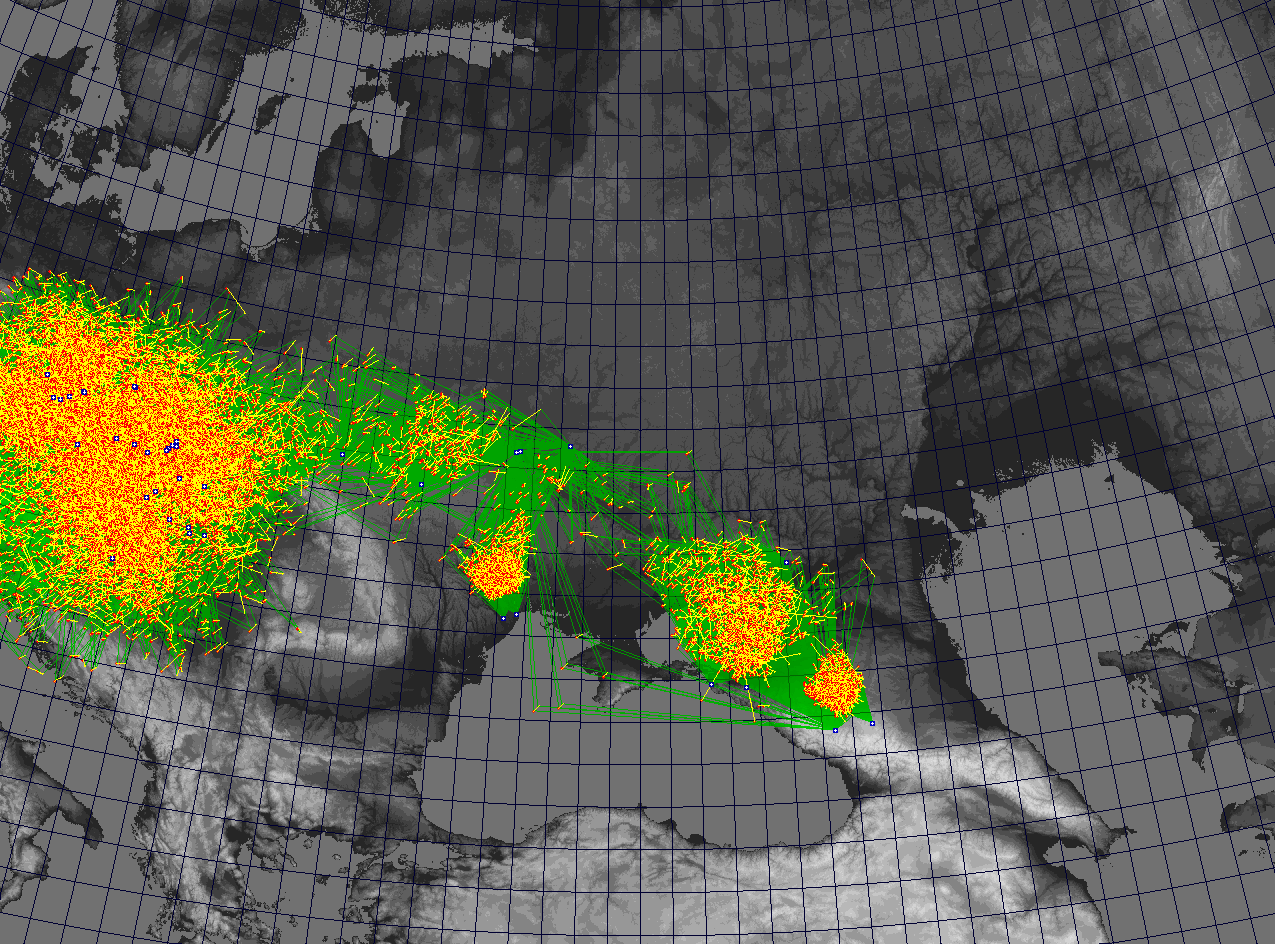
The EDMOND v6.01 database (Kornoš et al. 2014a,b) contains orbital elements and geophysical data for 628,271 orbits from 2001 to 2024 (last update 31 December 2024). The database is available in CSV format below.
Recent EDMOND Database (v6.01) to Download
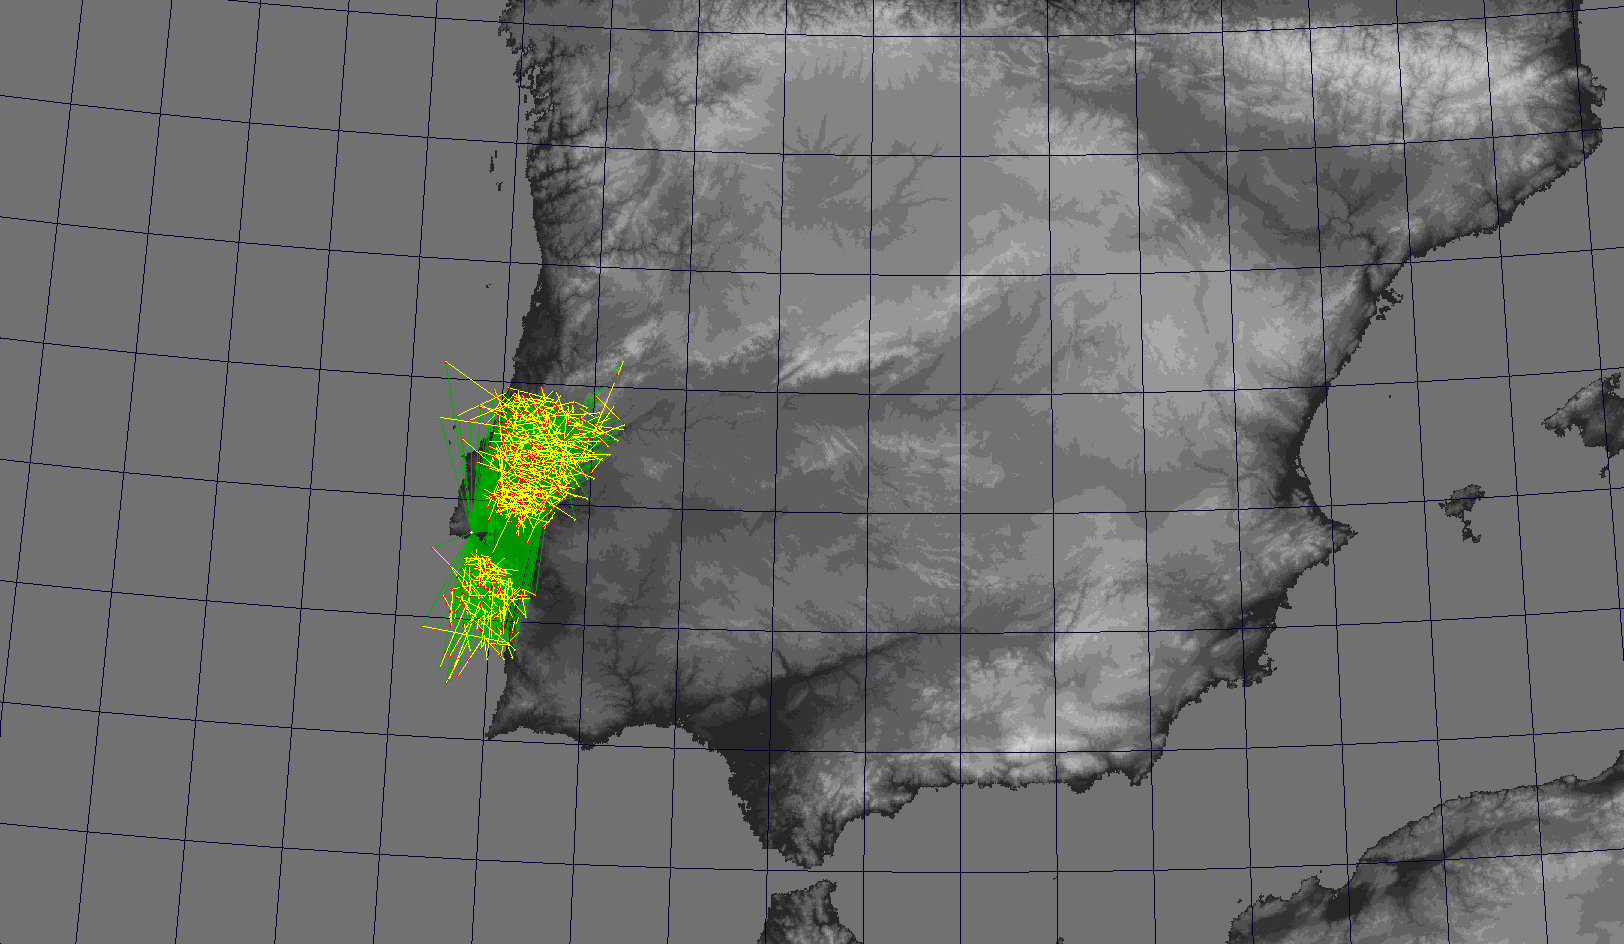
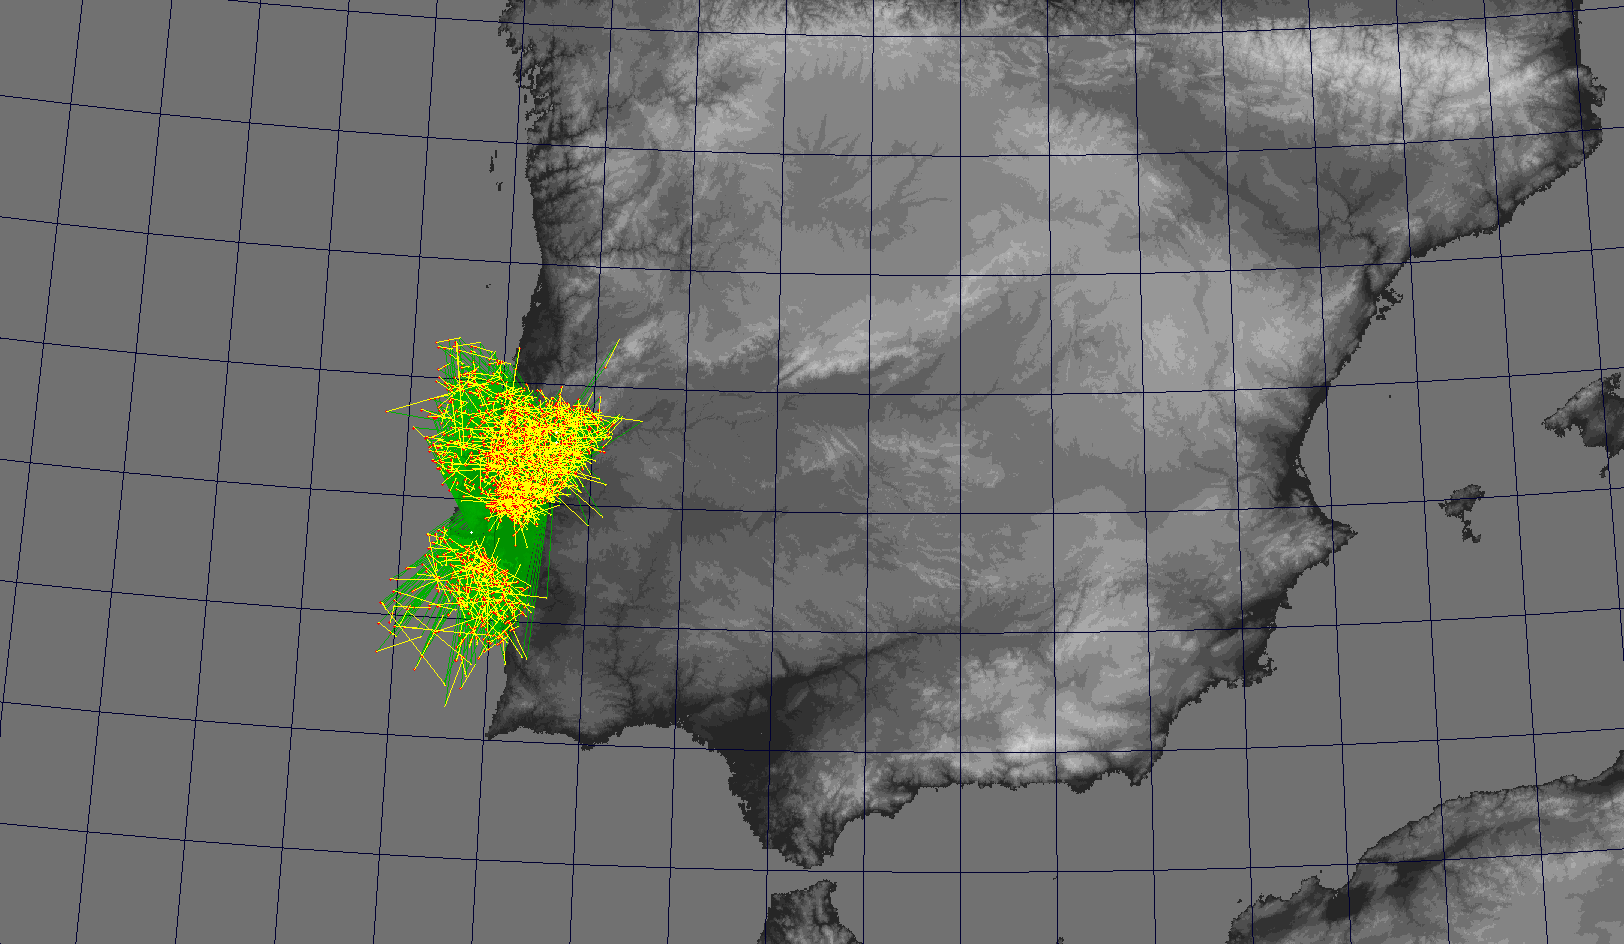
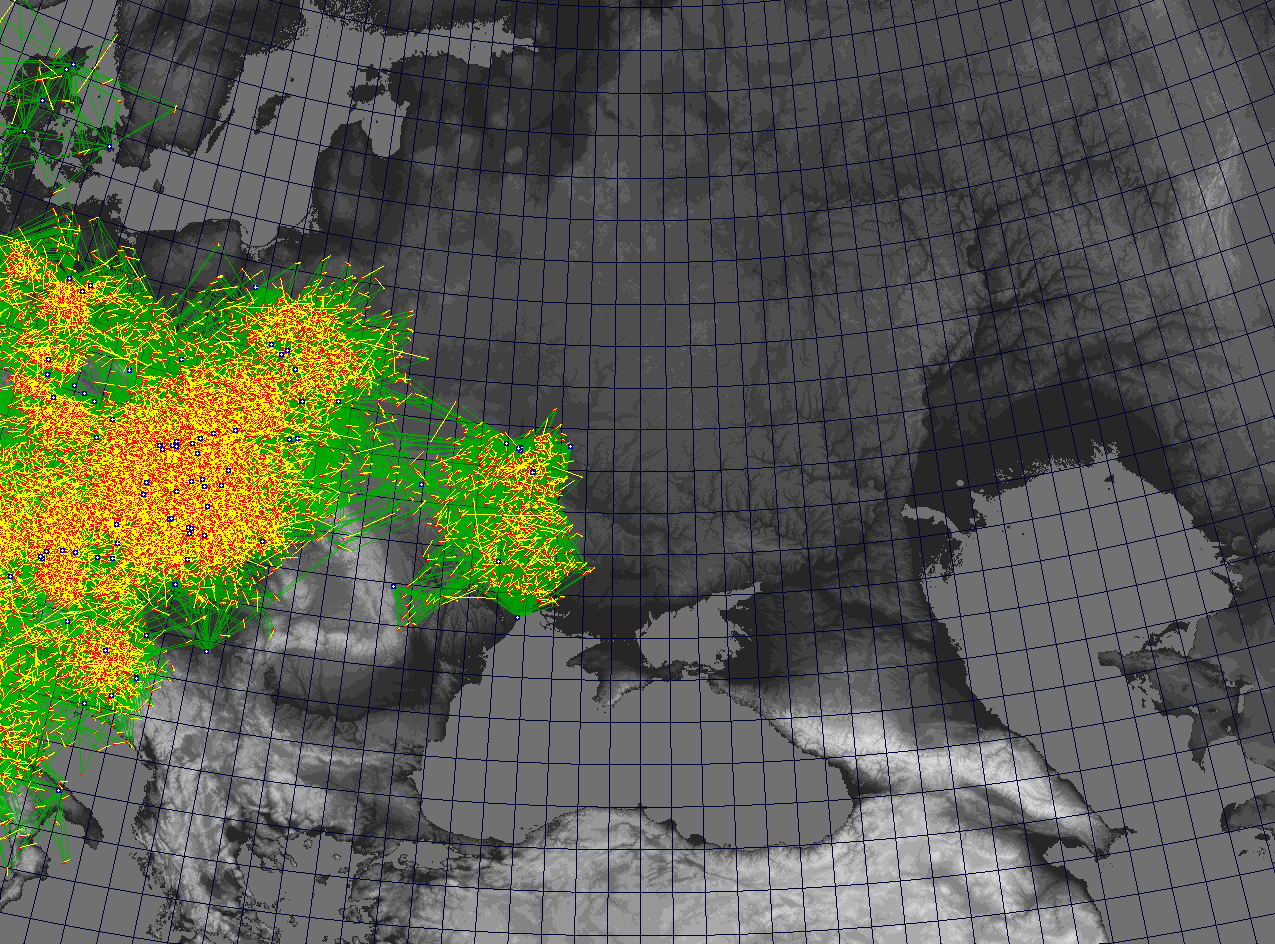
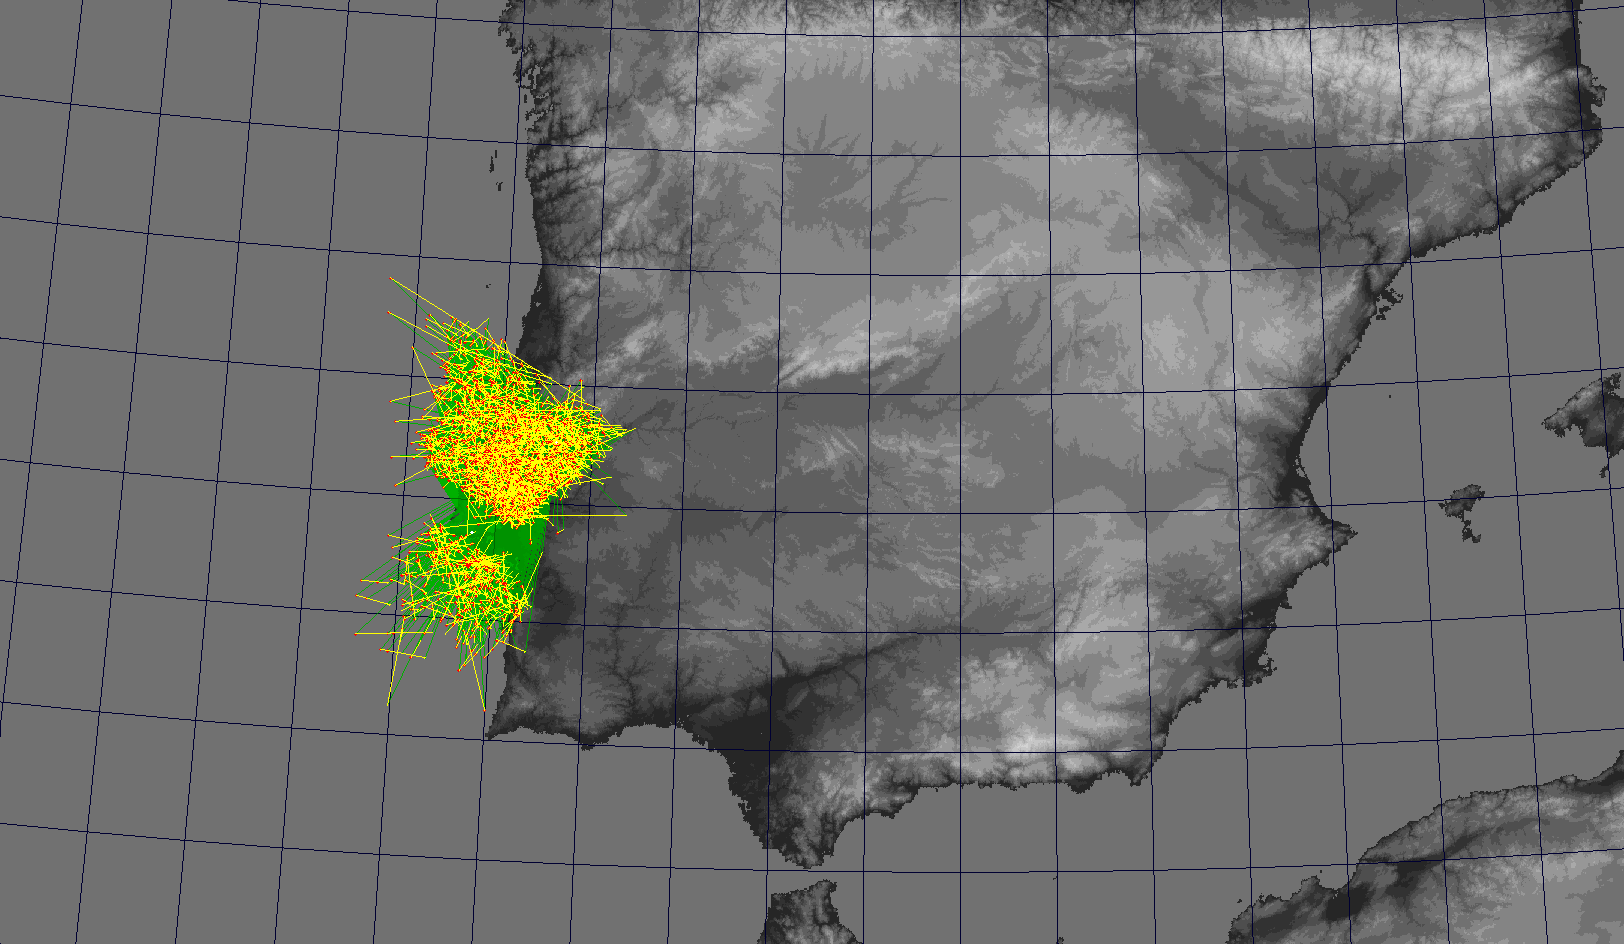
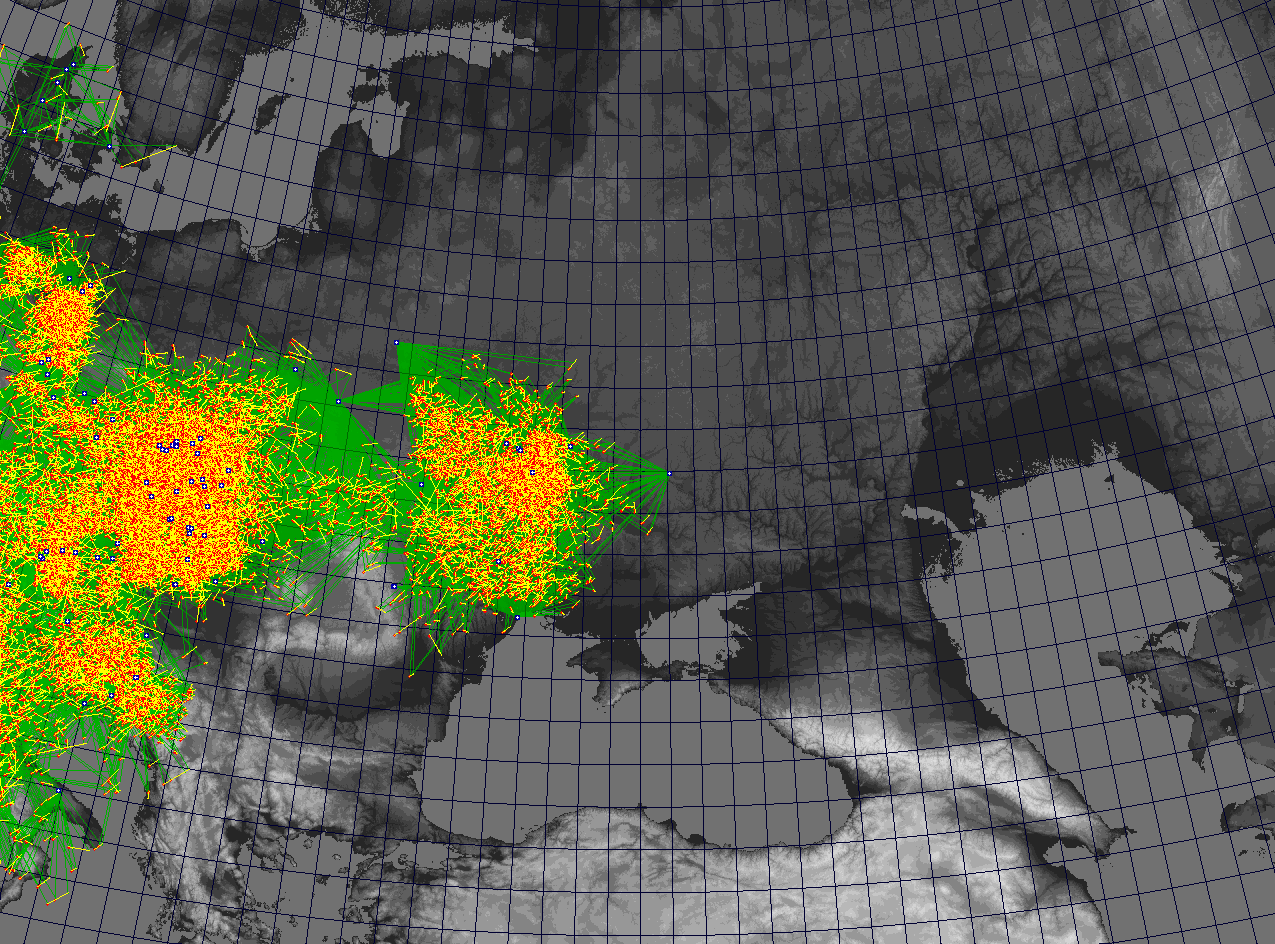
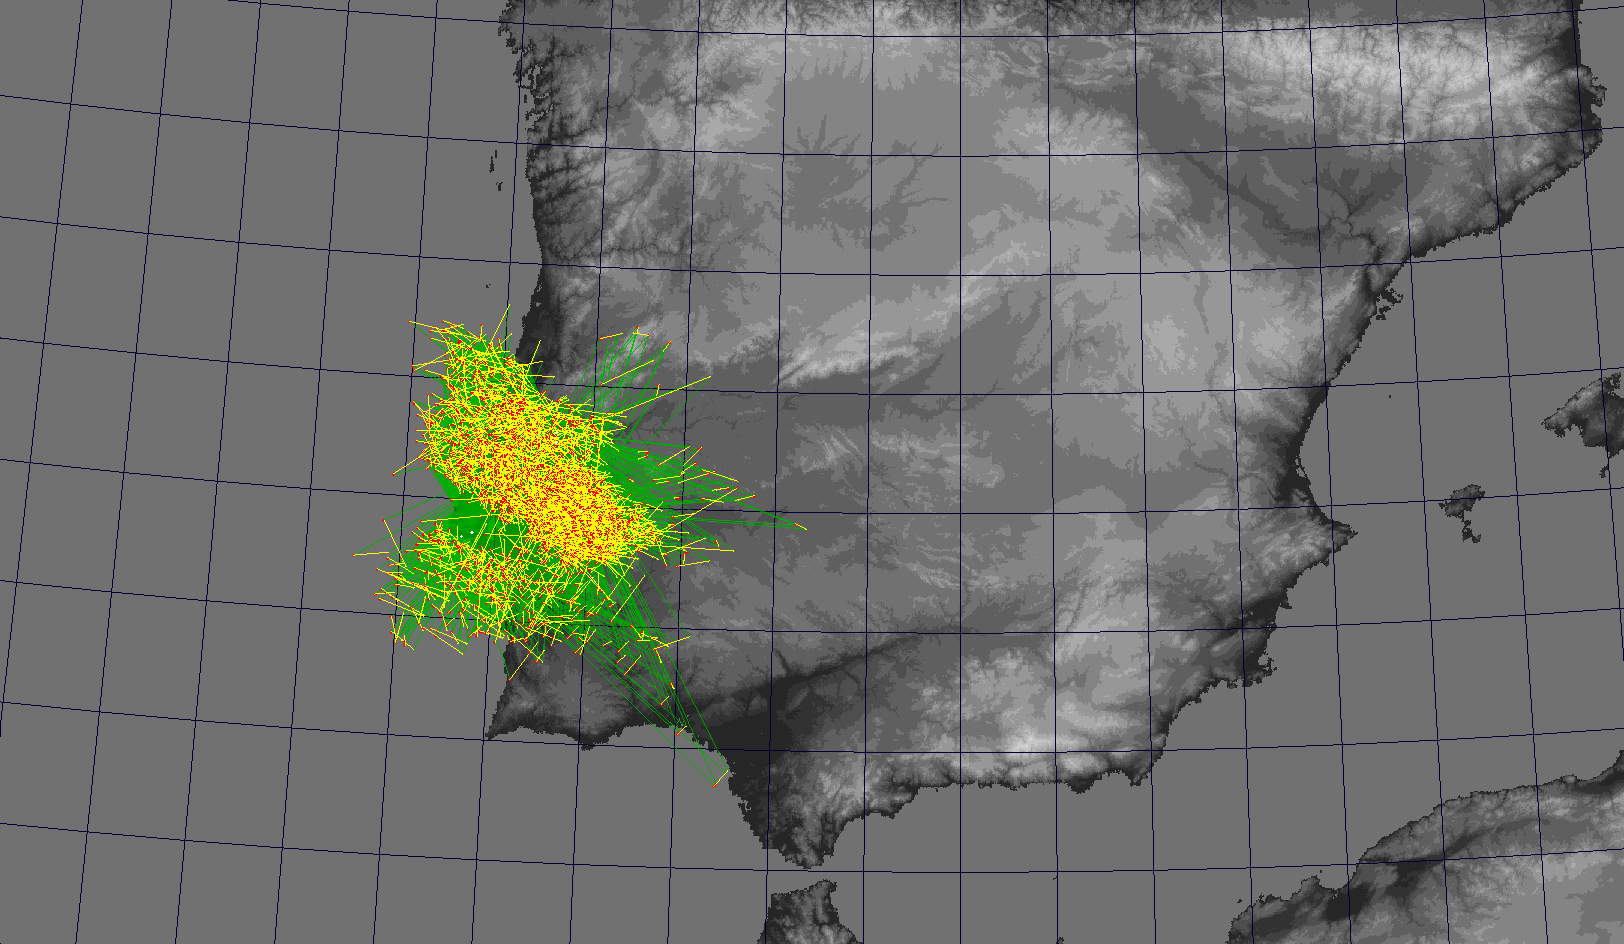
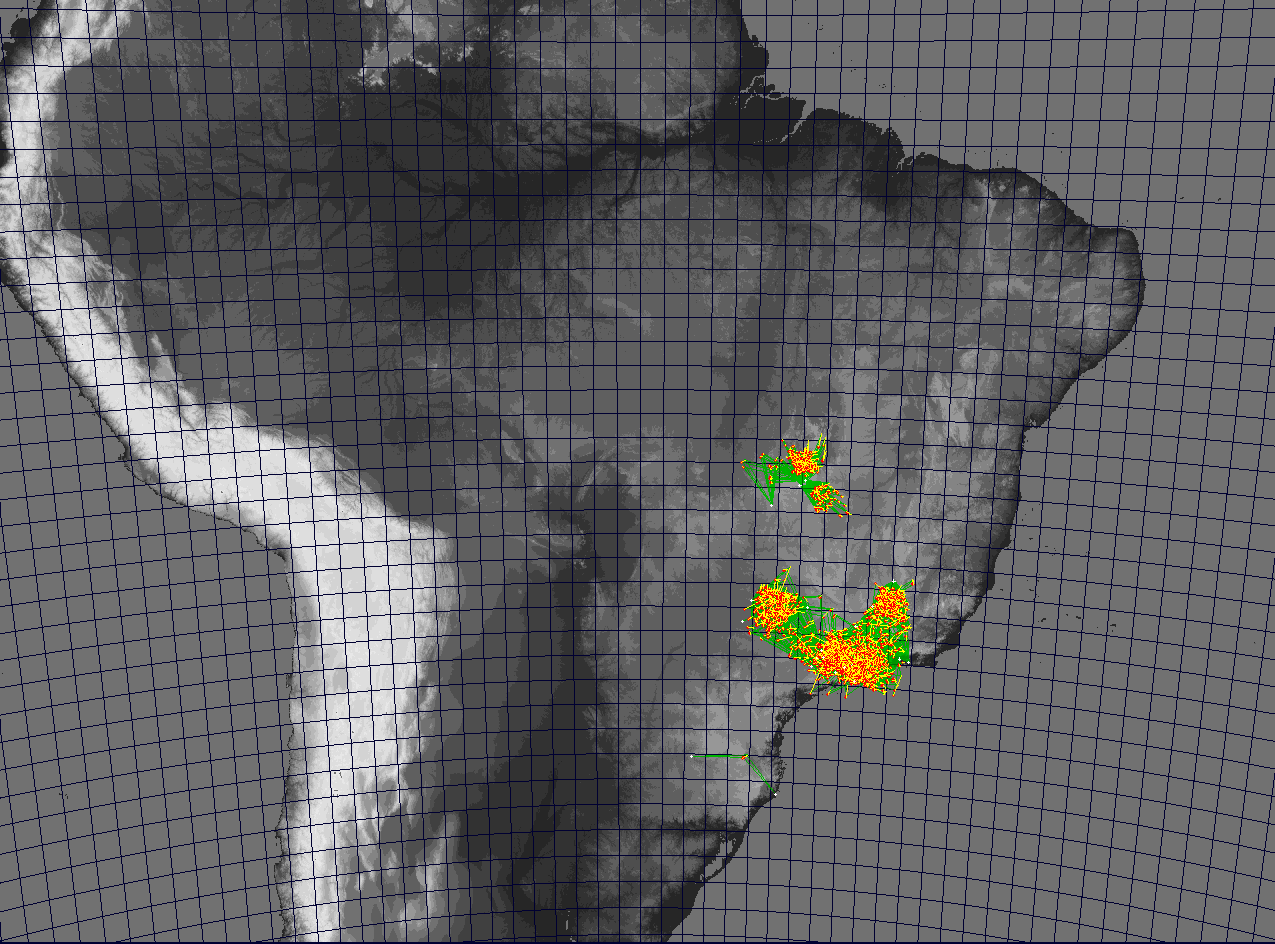
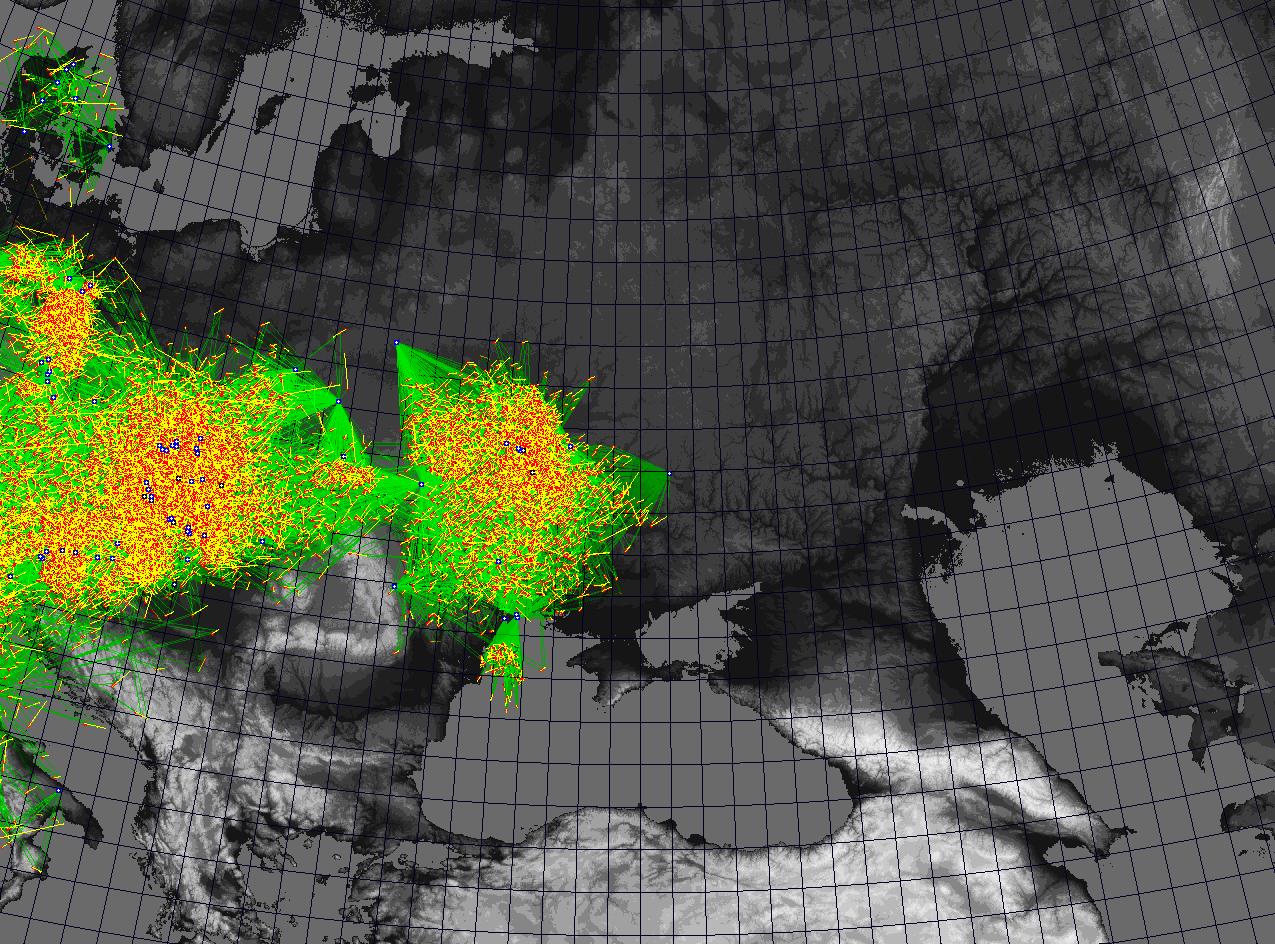
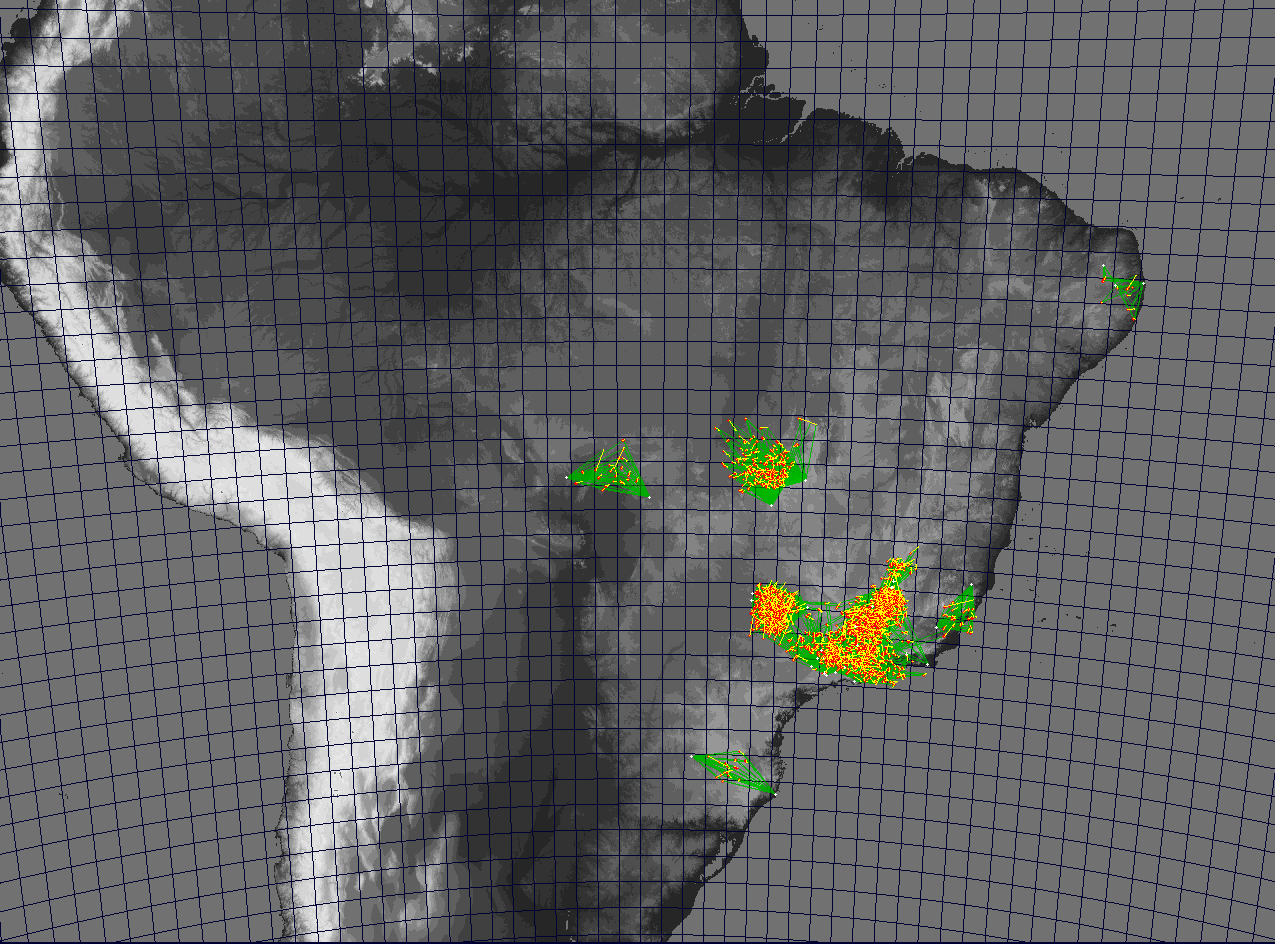
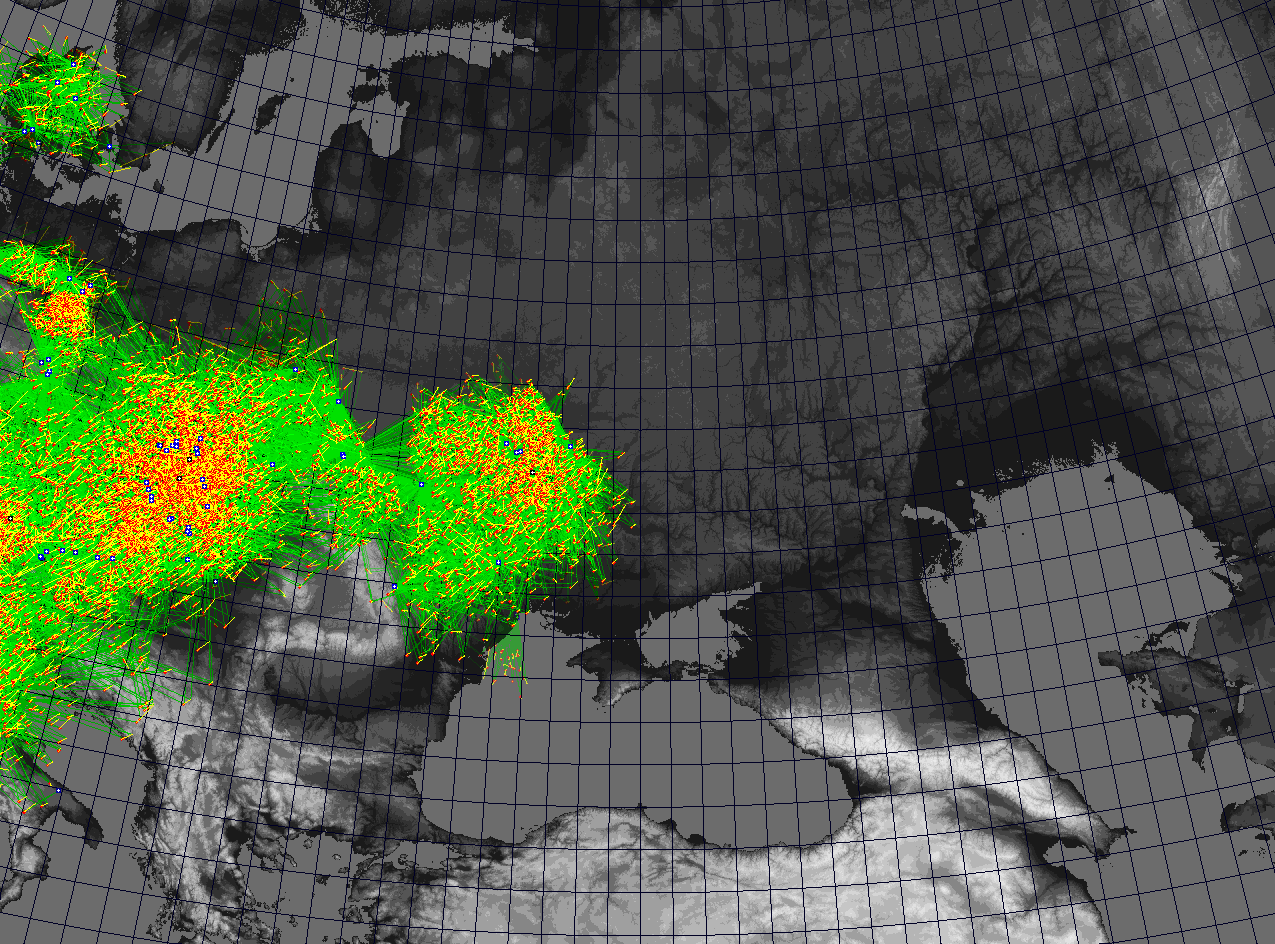
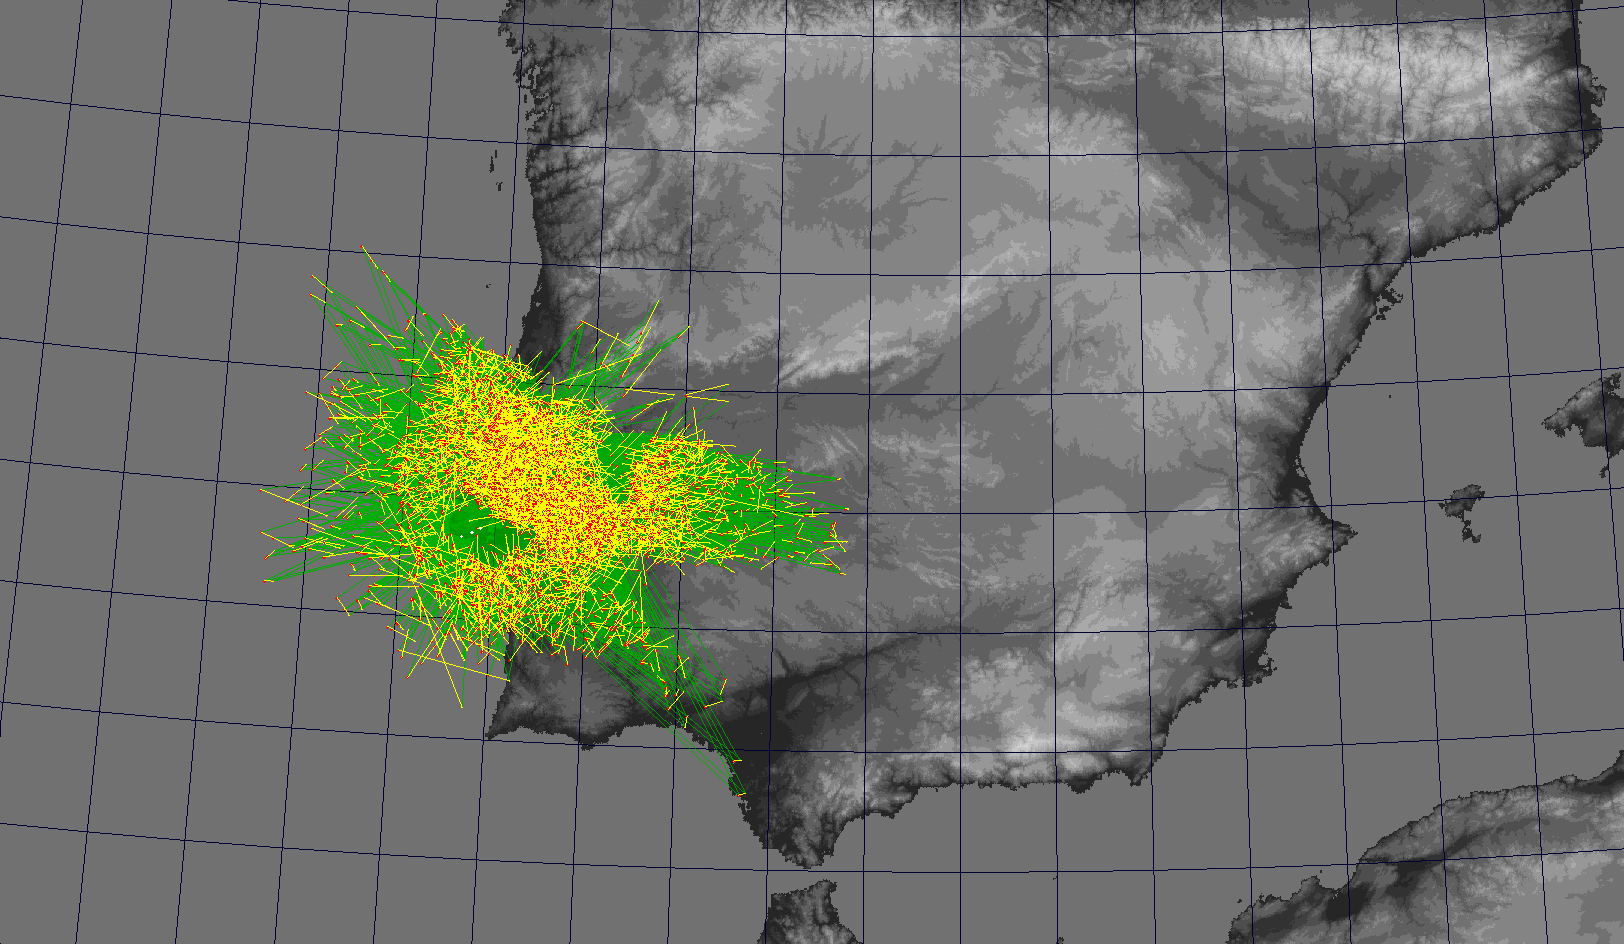
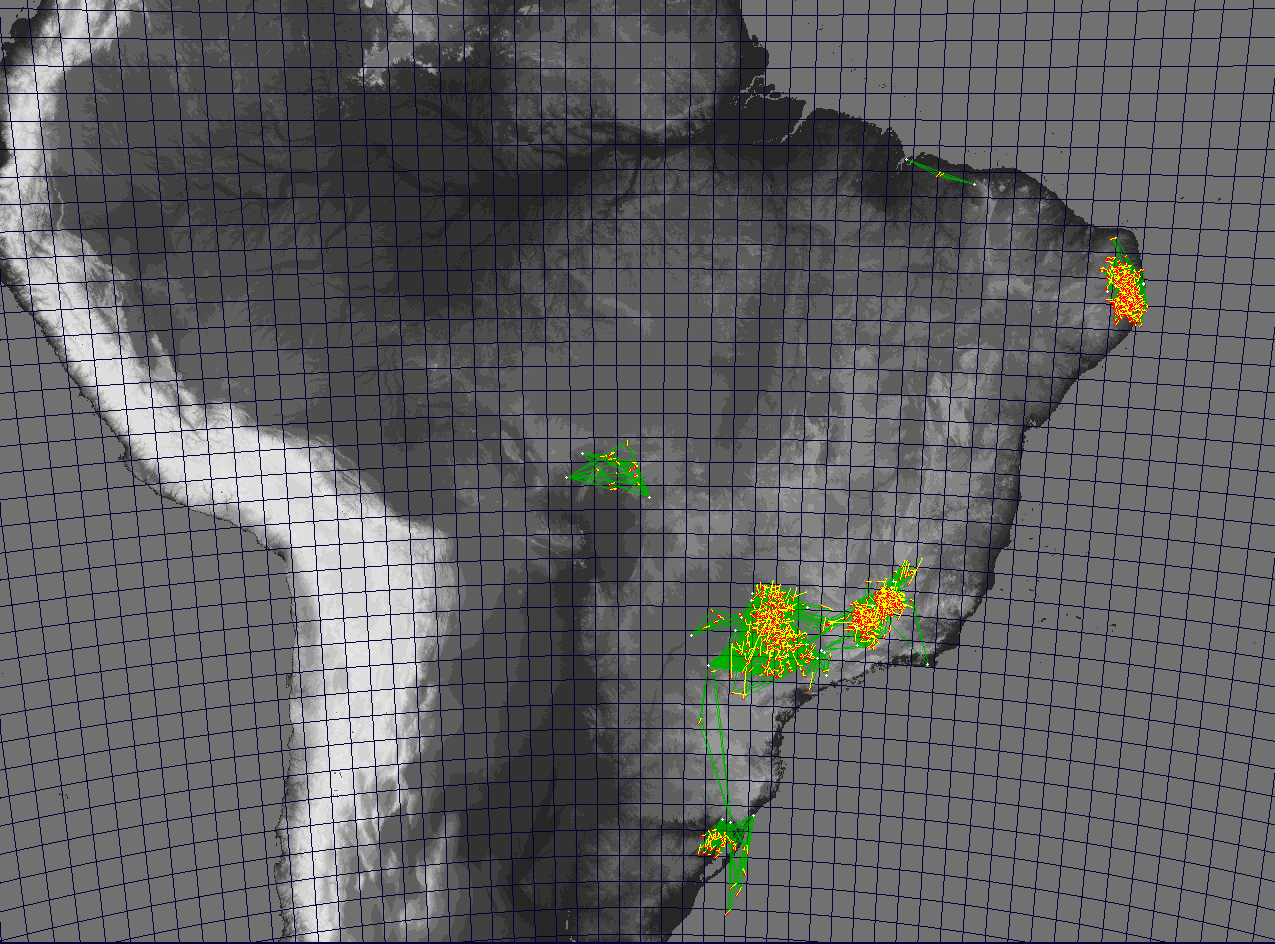
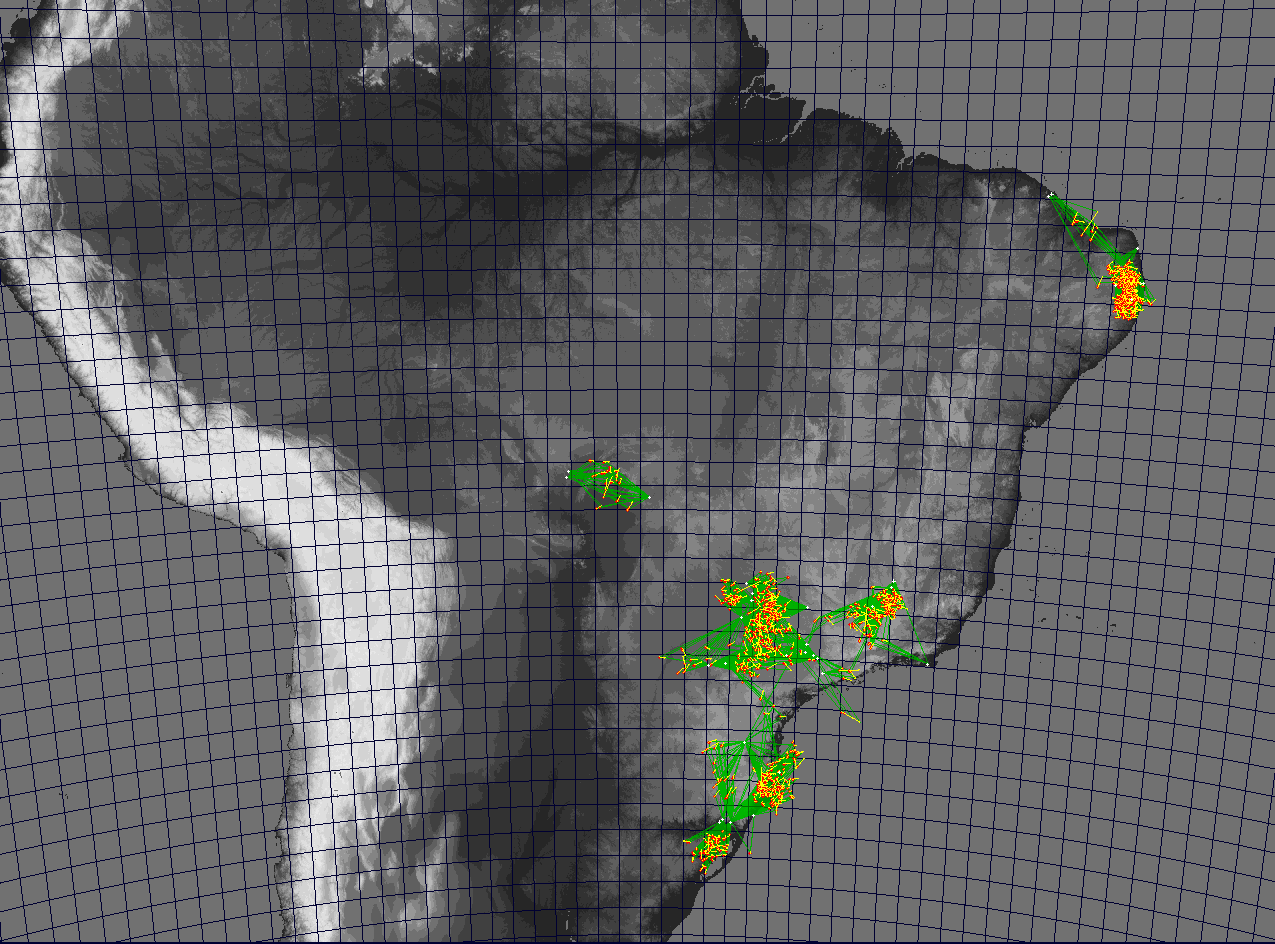
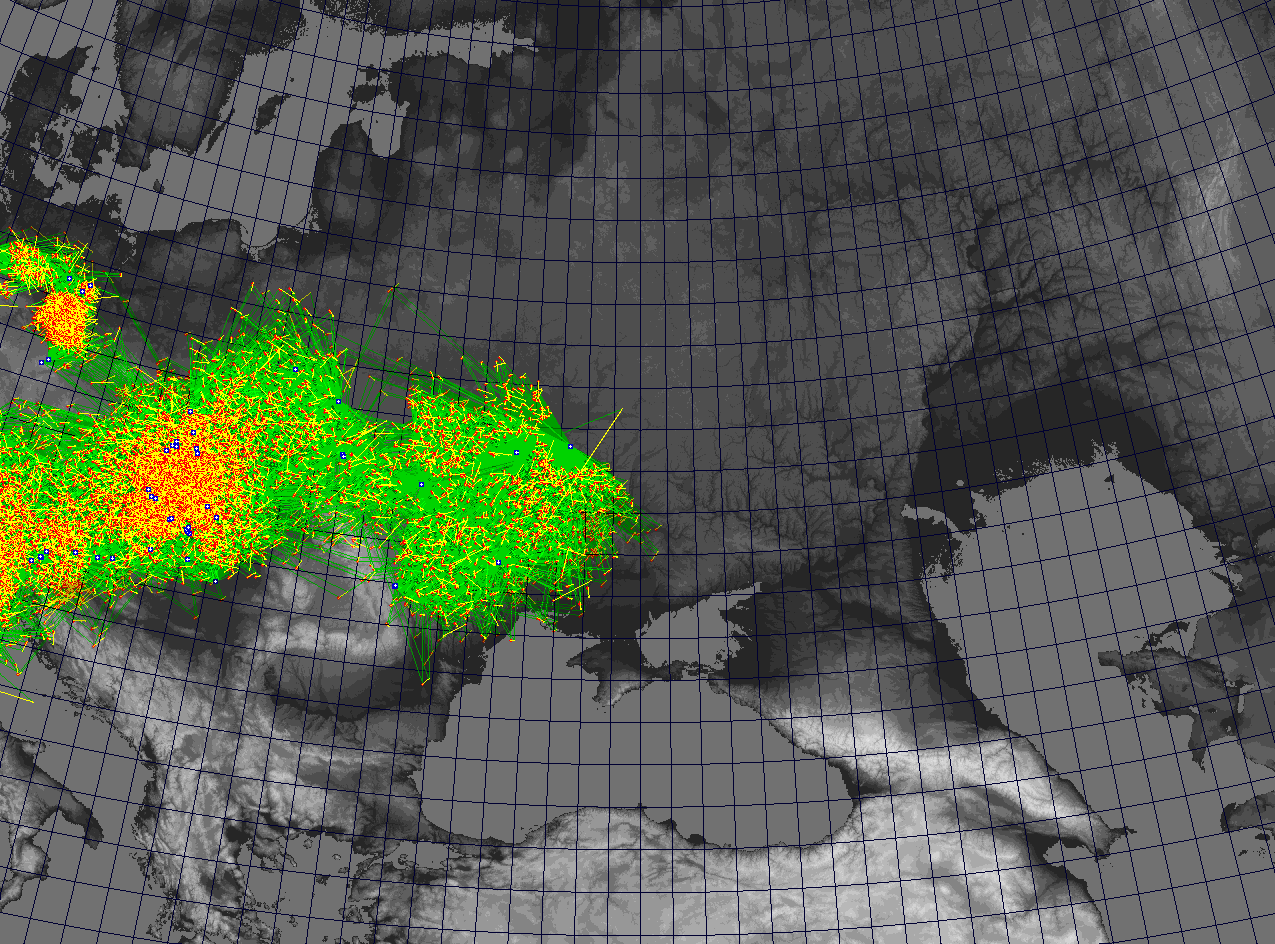
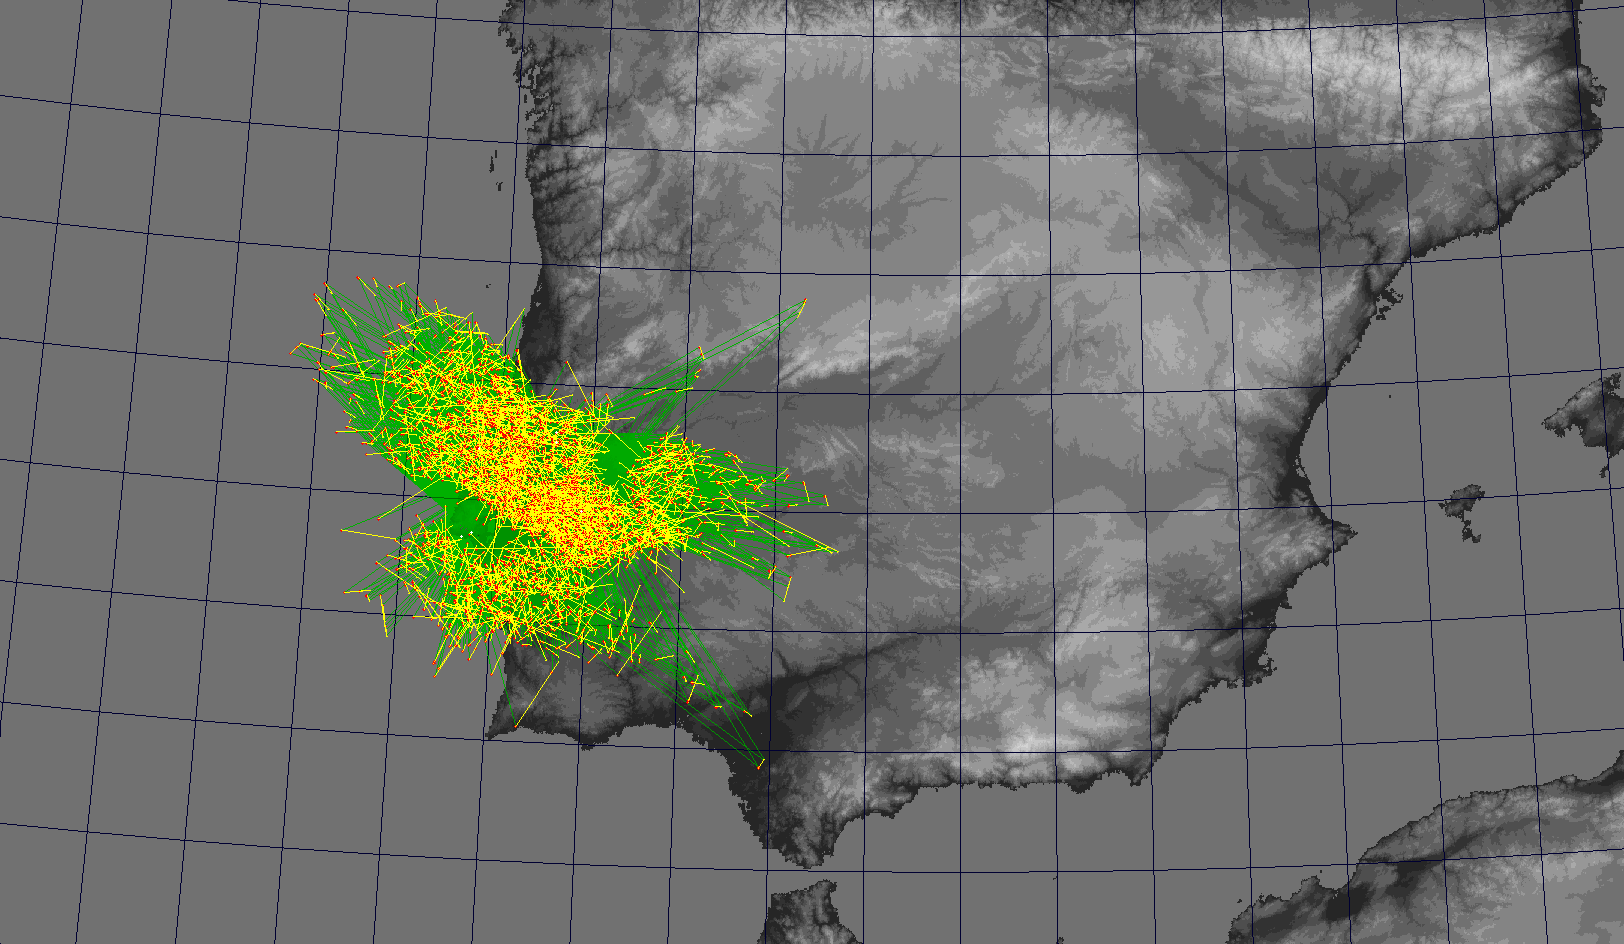
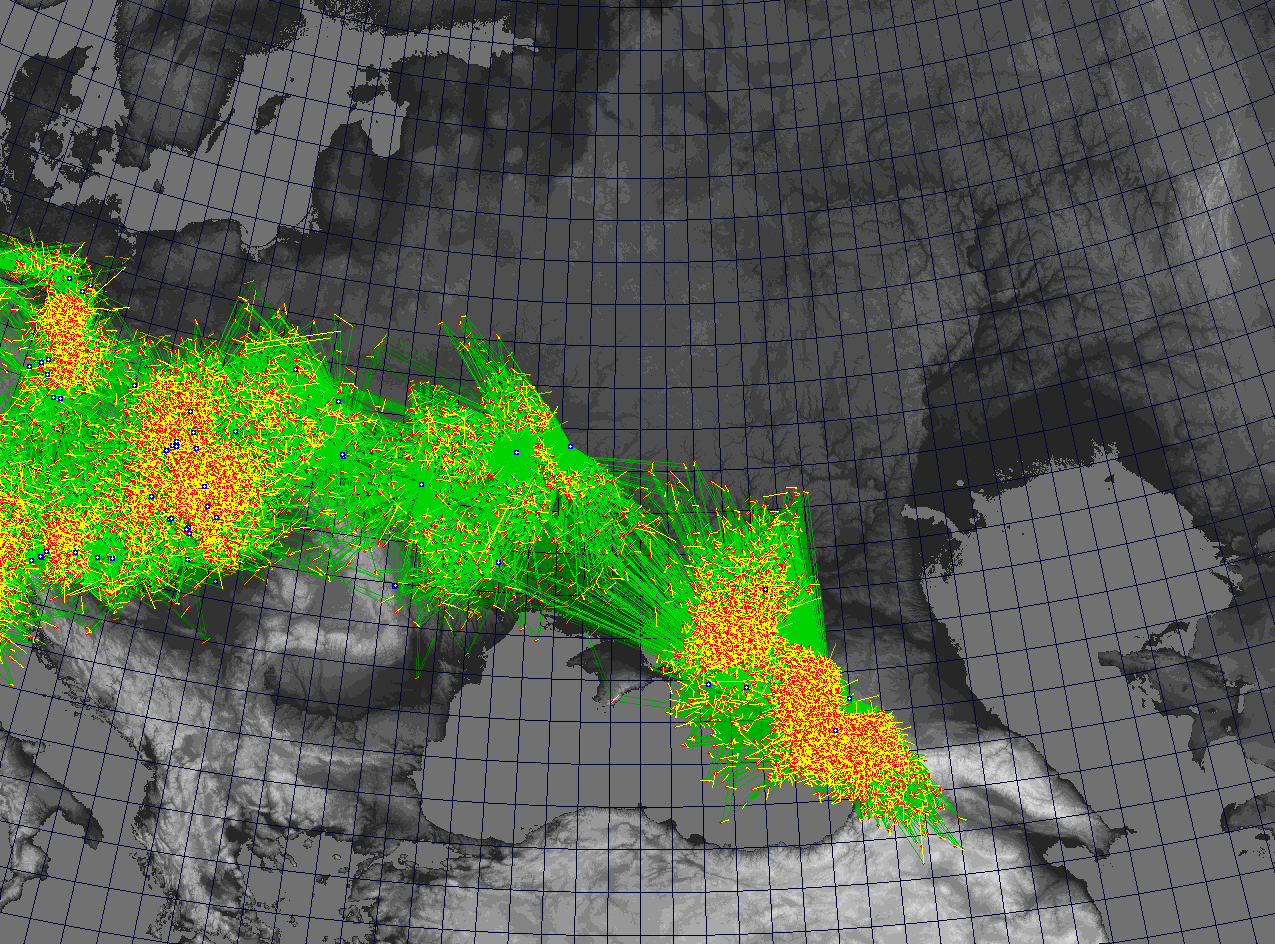
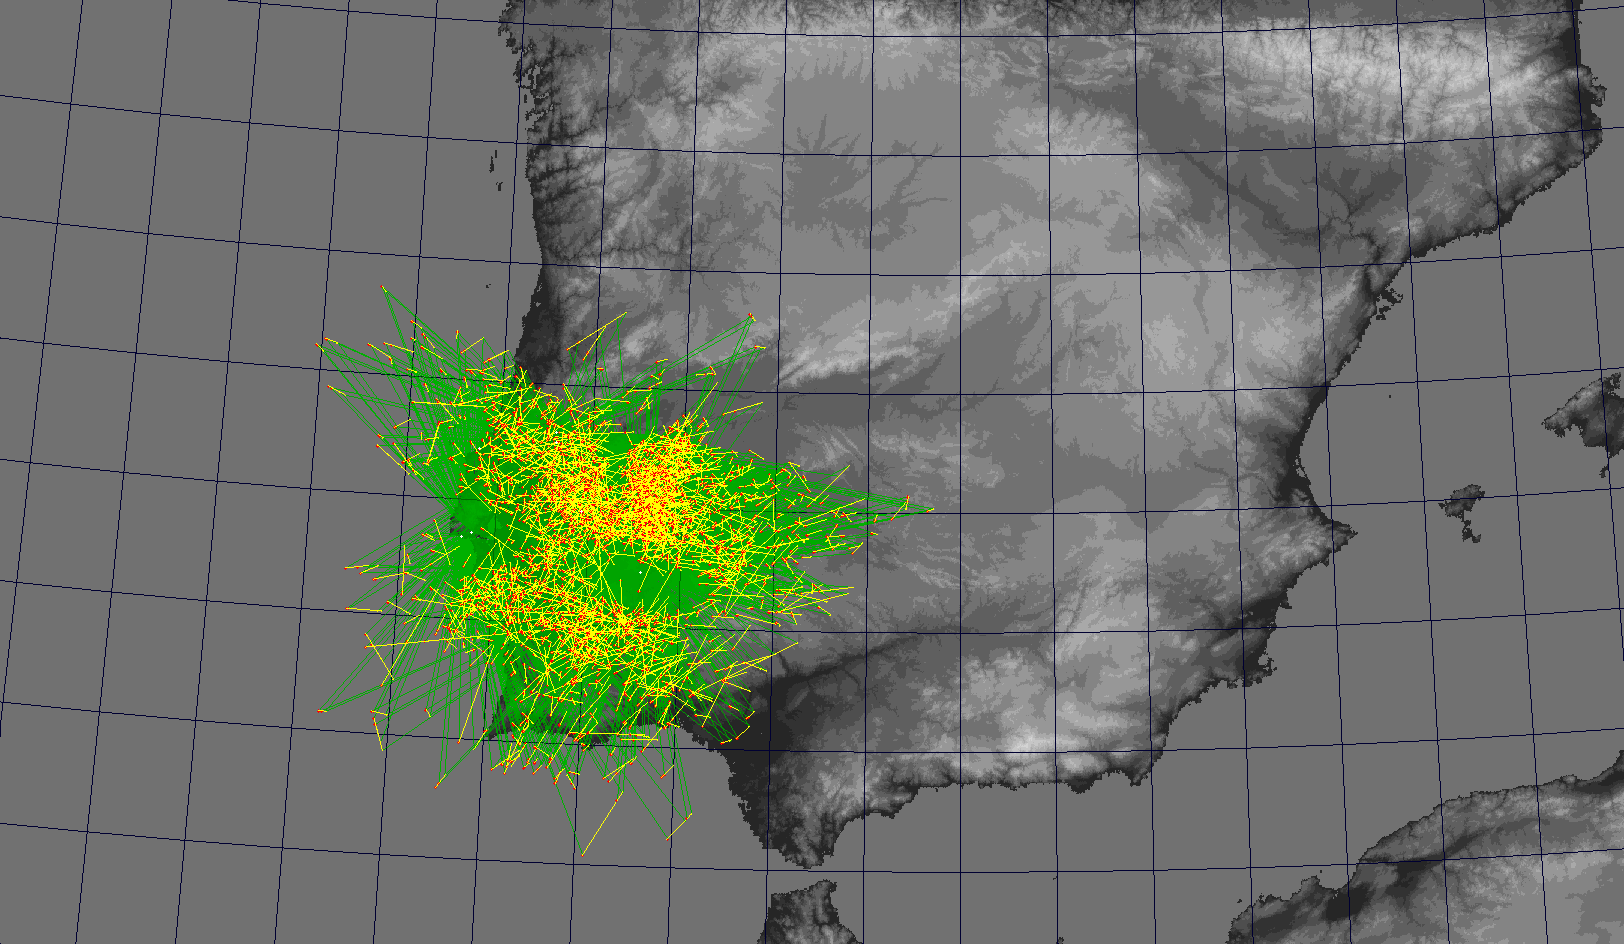
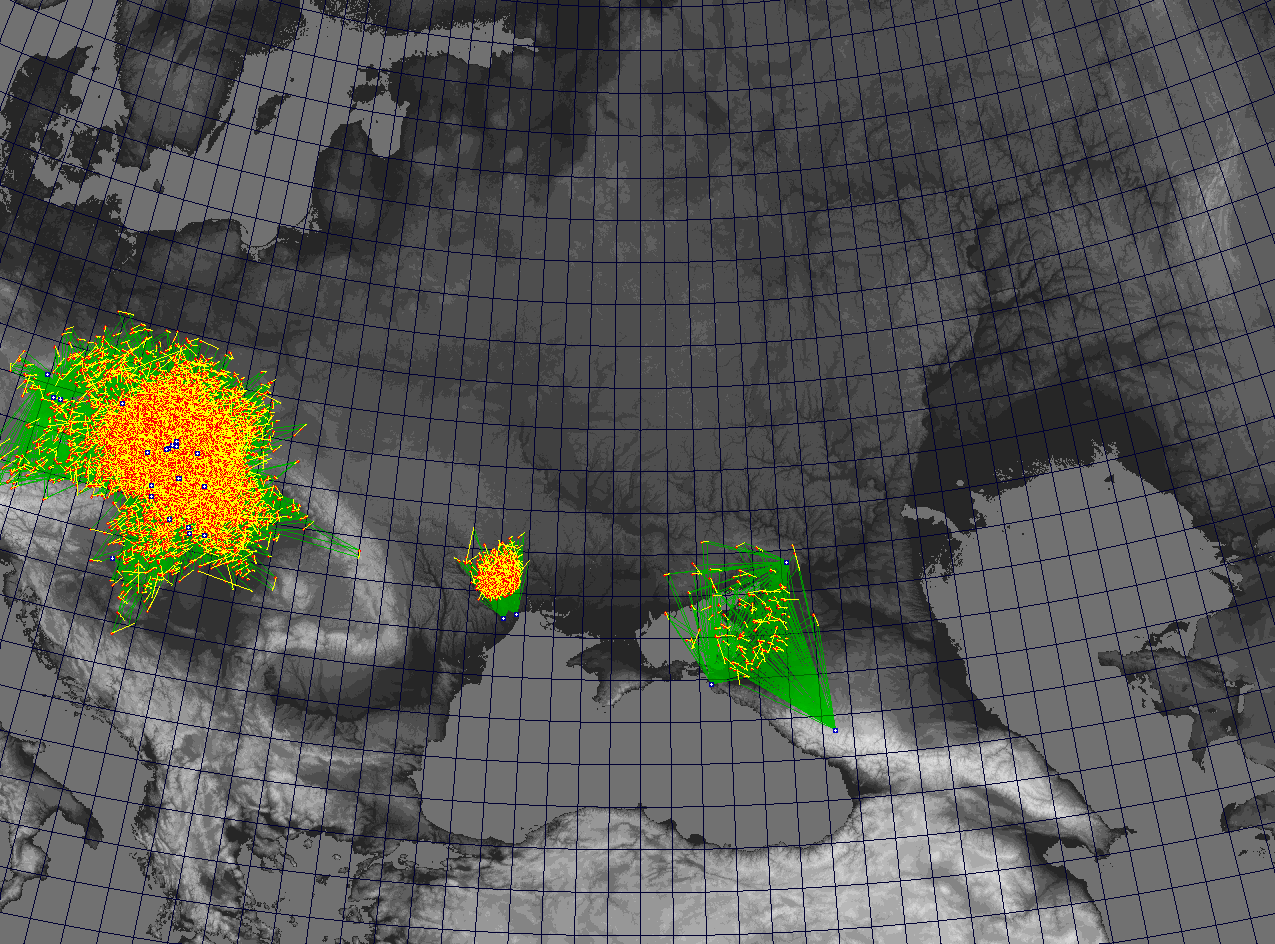
| YEAR | 2D Ground Map (Europe) | 2D Ground Map (Ukraine) | 2D Ground Map (Portugal) | 2D Ground Map (Brazil) | Database CSV File |
|---|---|---|---|---|---|
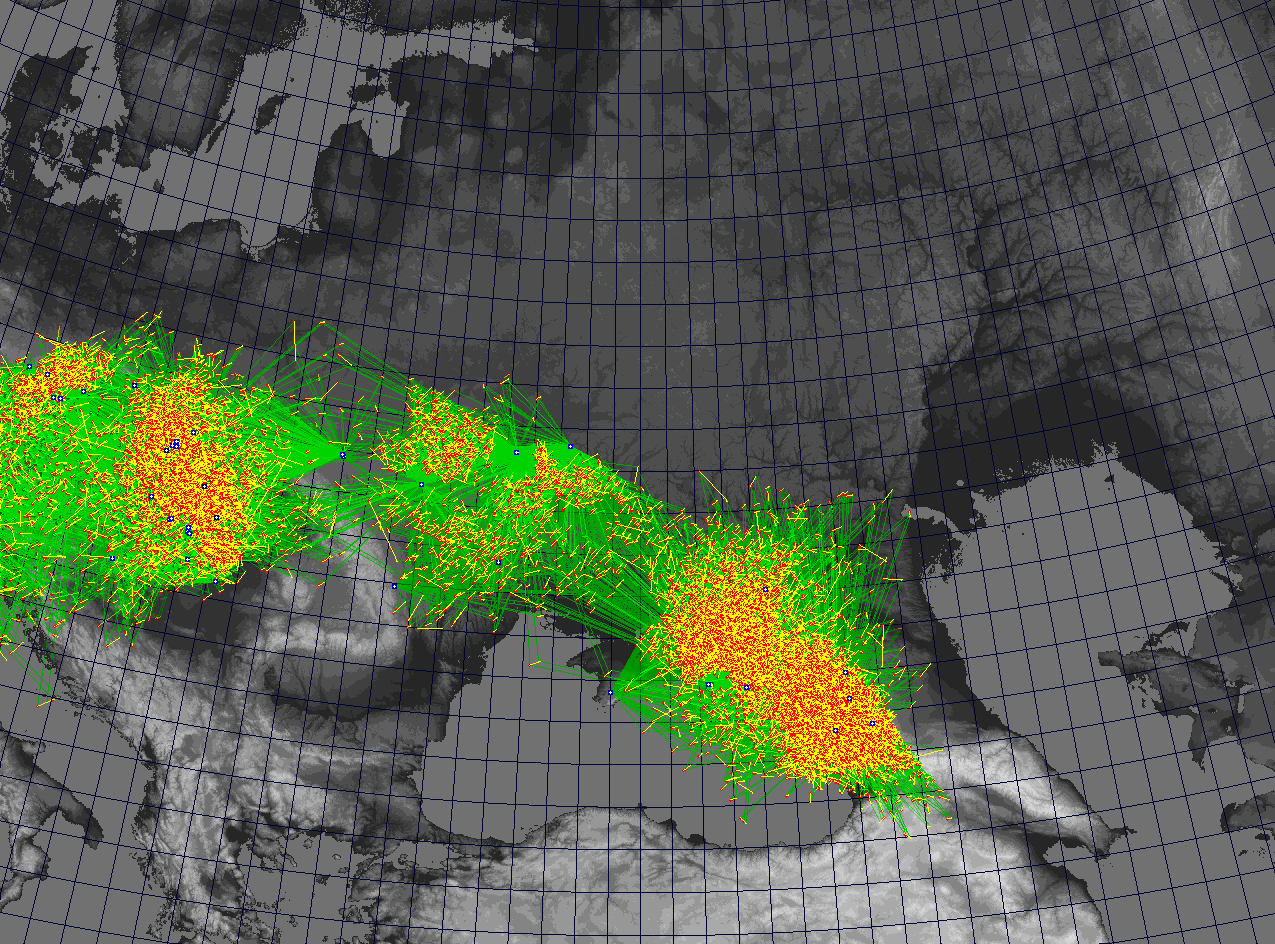
| 2001 |  |
U2_2001_EDM.zip | |||
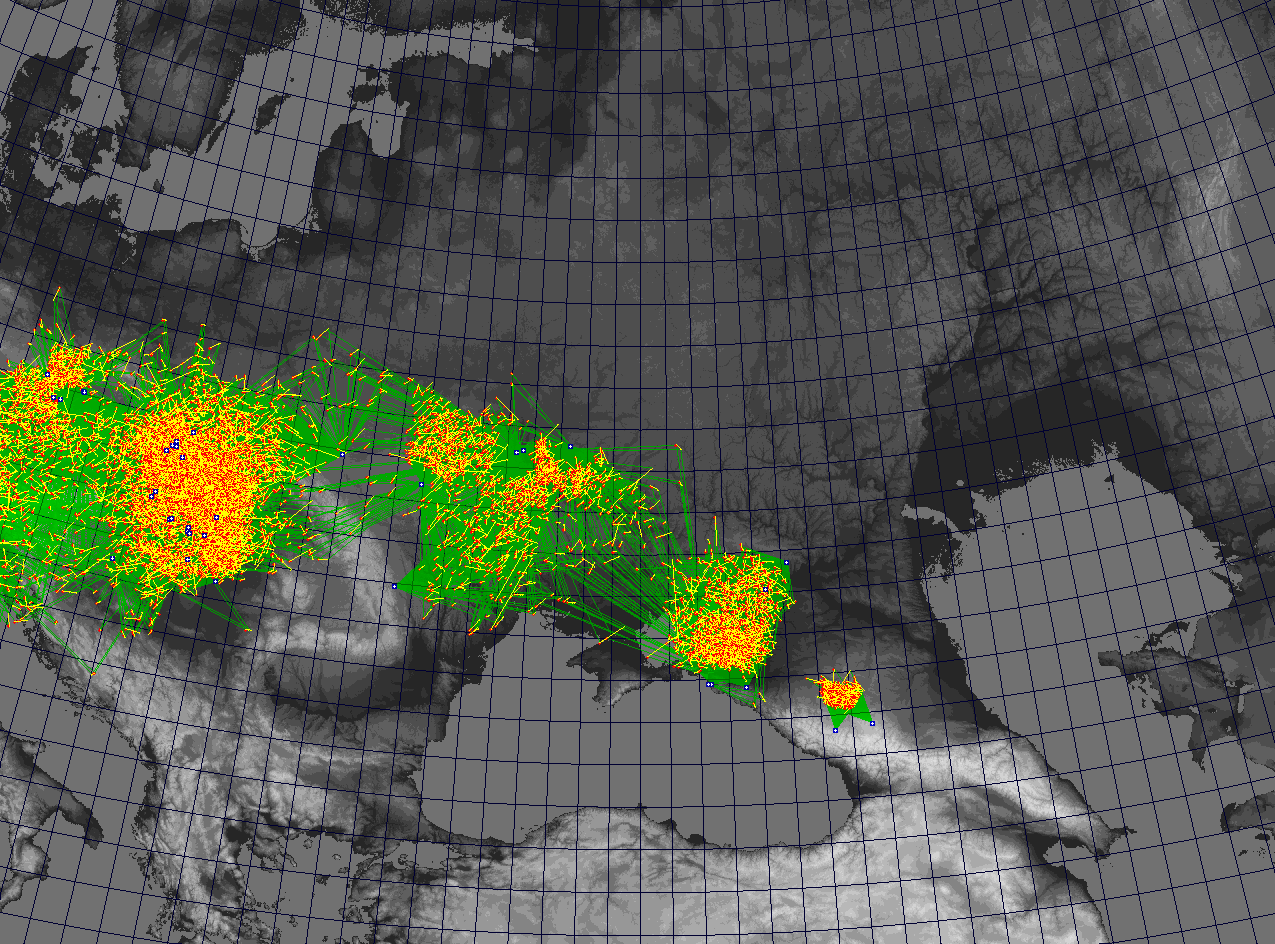
| 2002 |  |
U2_2002_EDM.zip | |||
| 2003 |  |
U2_2003_EDM.zip | |||
| 2004 |  |
U2_2004_EDM.zip | |||
| 2005 |  |
U2_2005_EDM.zip | |||
| 2006 | 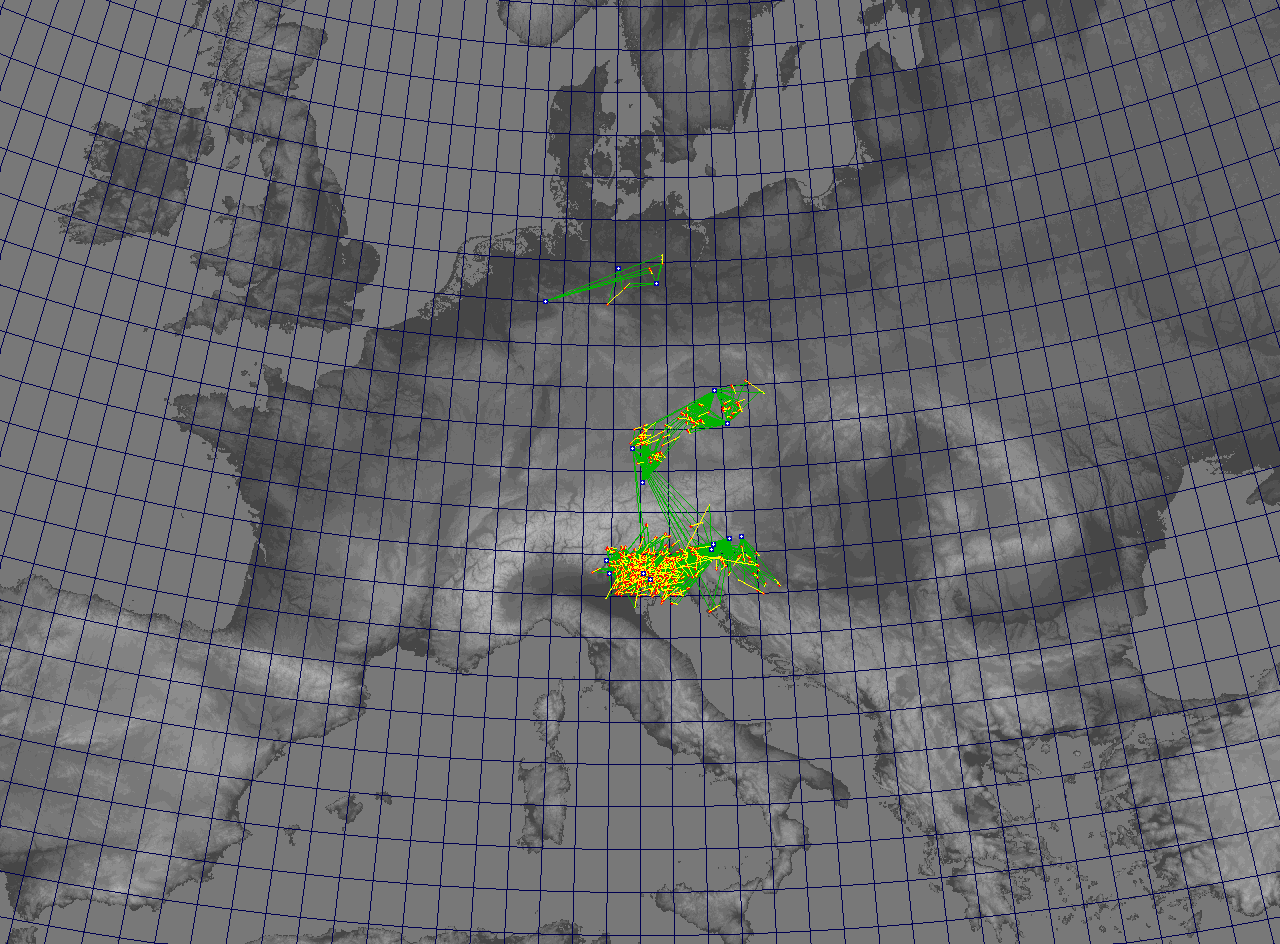 |
U2_2006_EDM.zip | |||
| 2007 | 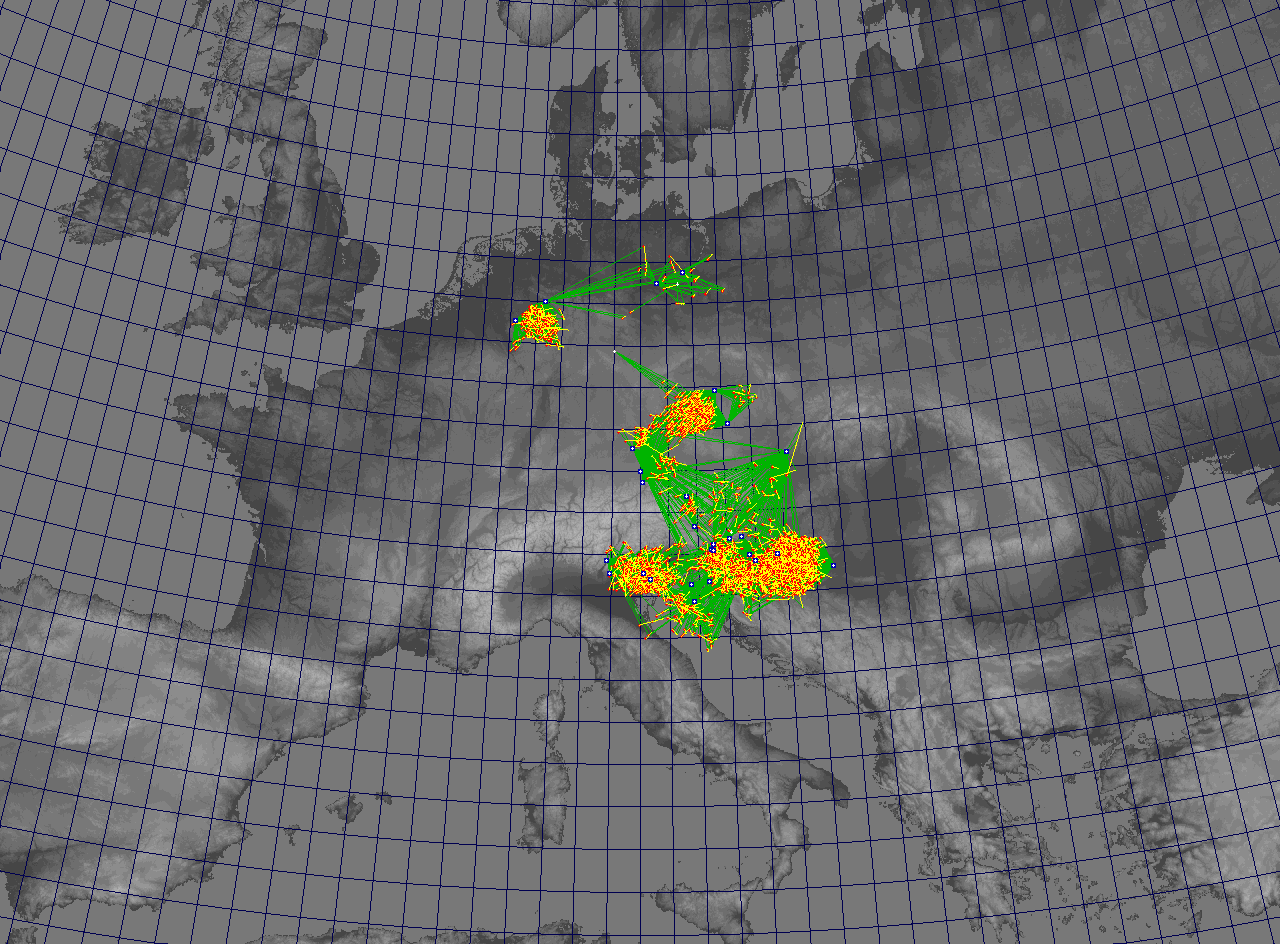 |
U2_2007_EDM.zip | |||
| 2008 | 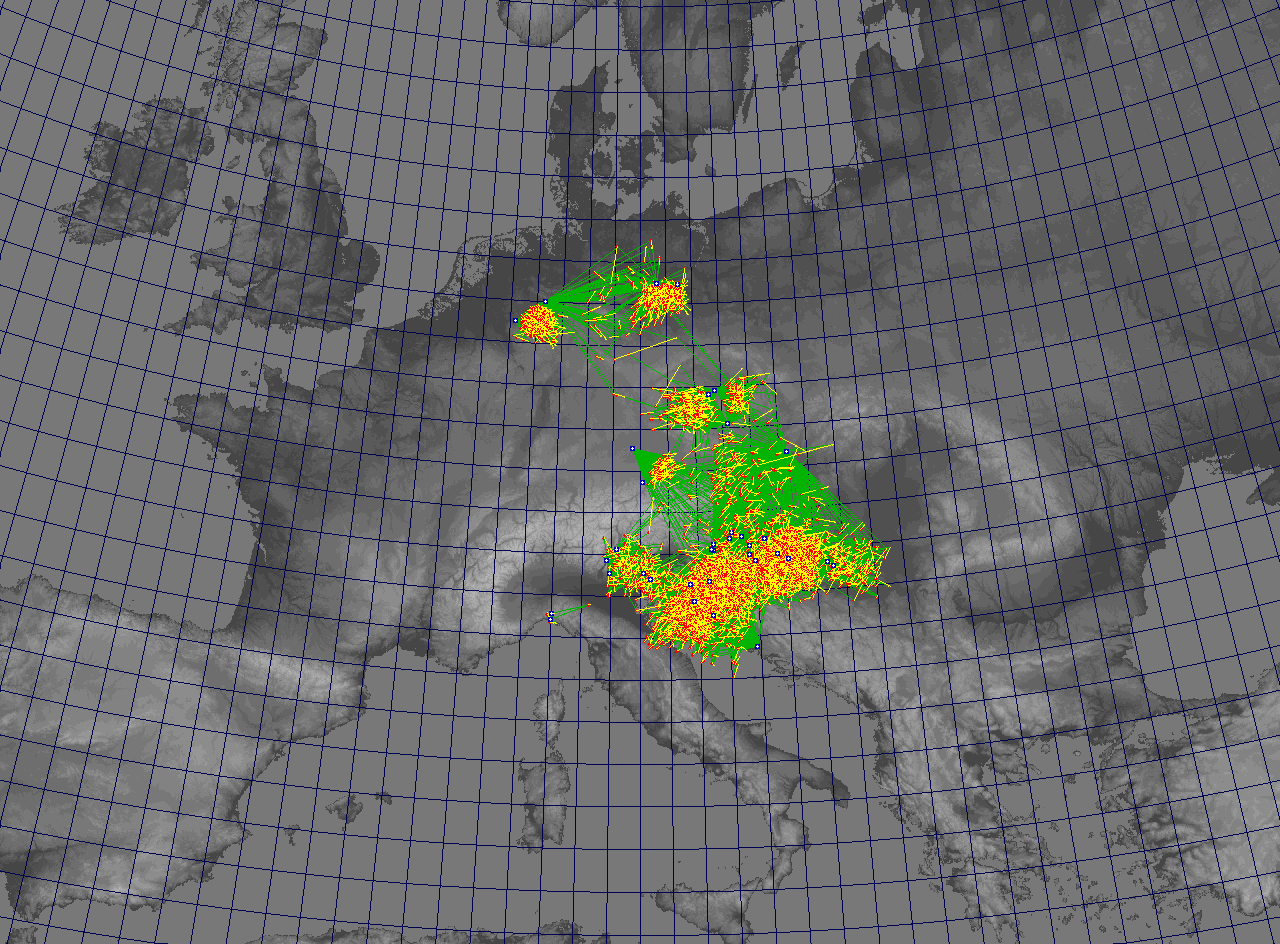 |
U2_2008_EDM.zip | |||
| 2009 | 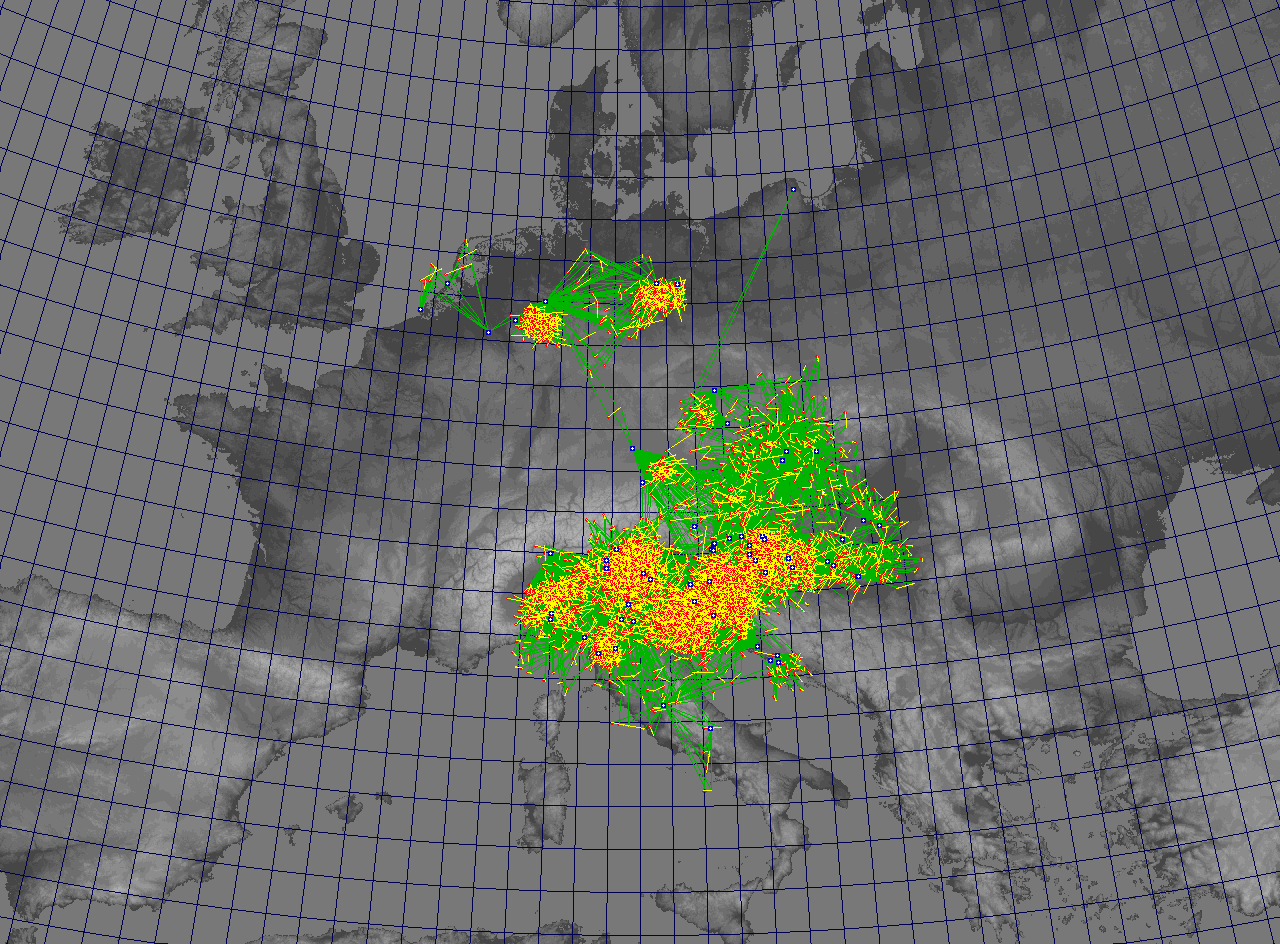 |
U2_2009_EDM.zip | |||
| 2010 | 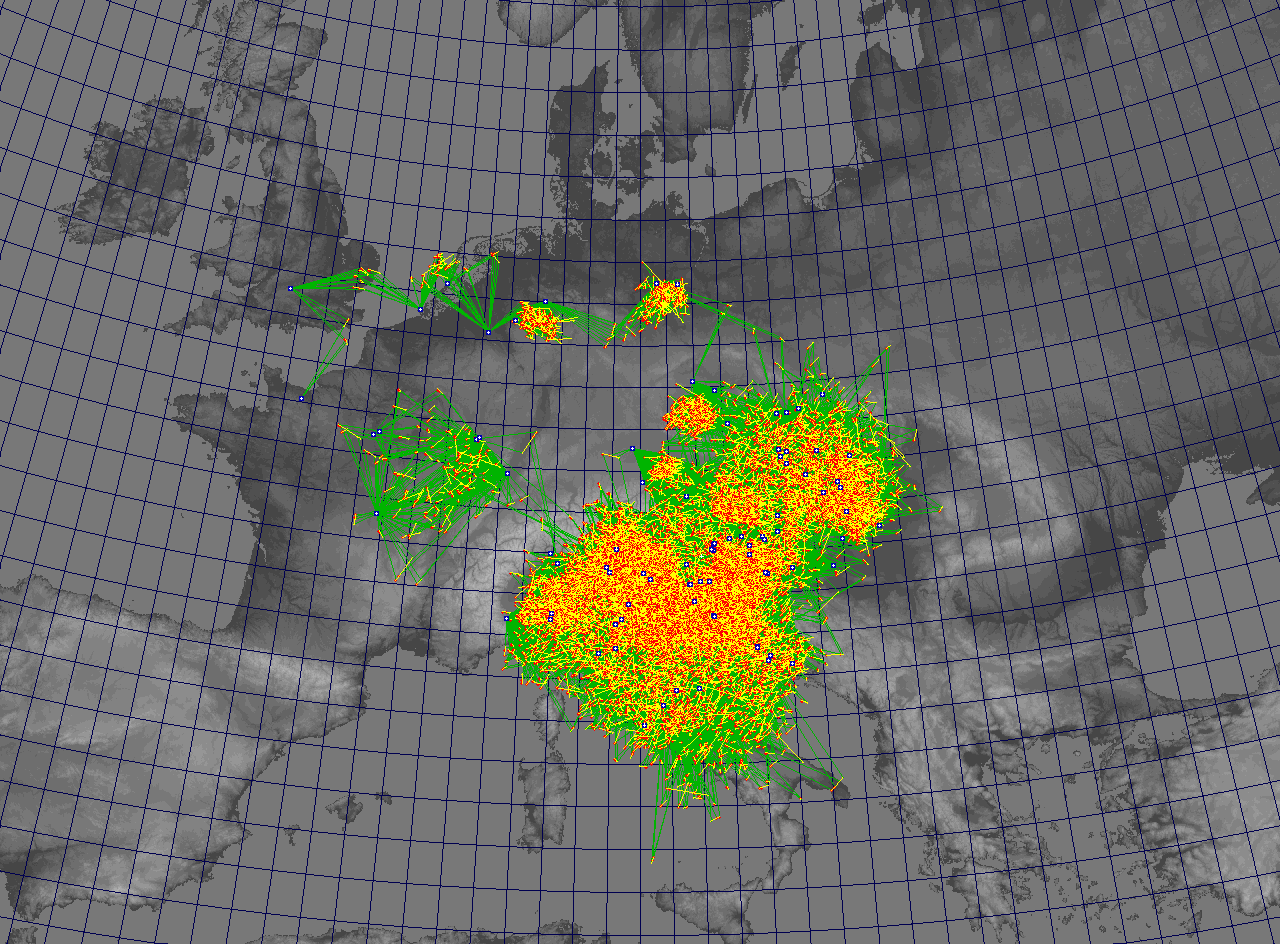 |
U2_2010_EDM.zip | |||
| 2011 | 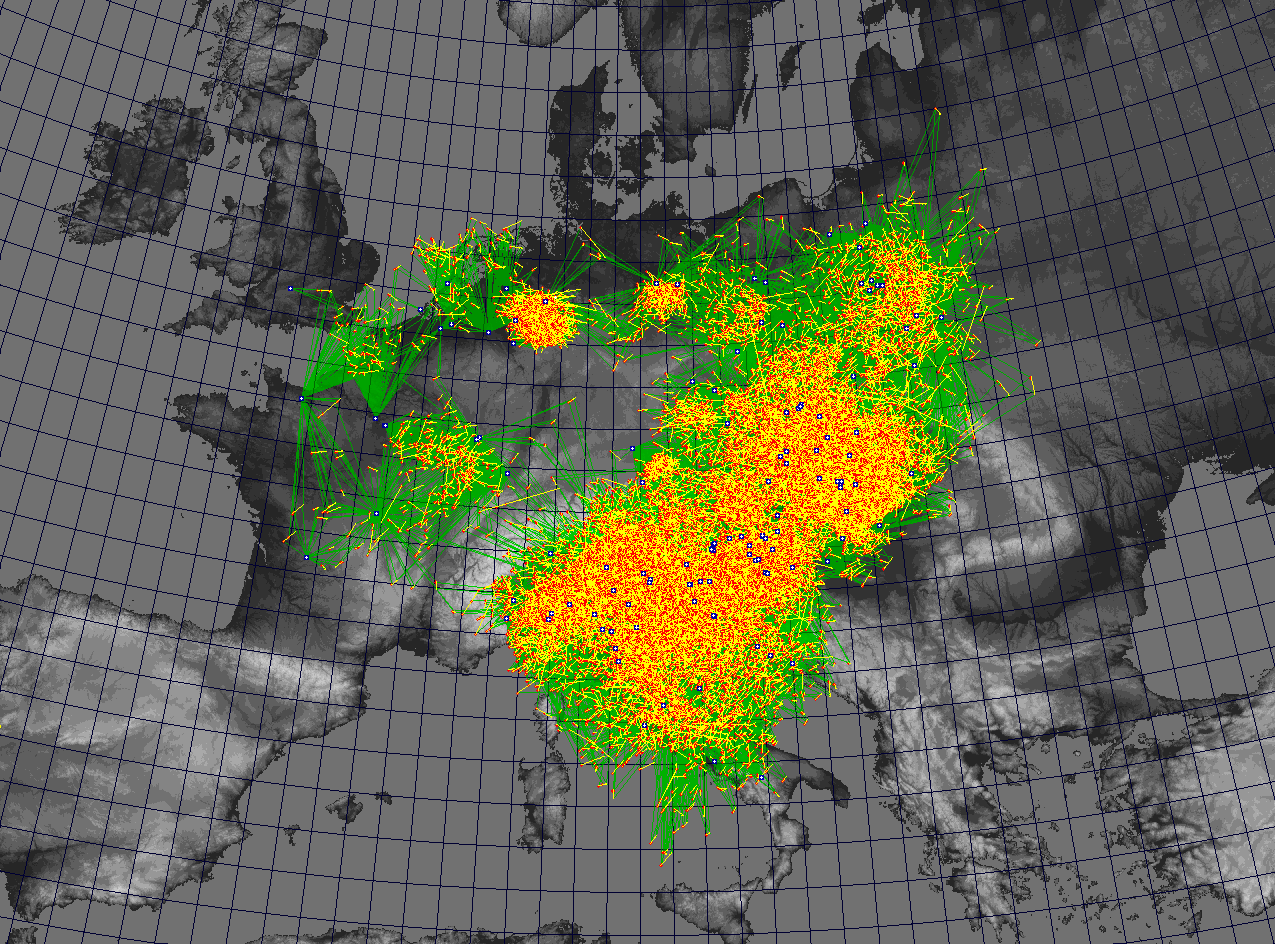 |
 |
U2_2011_EDM.zip | ||
| 2012 | 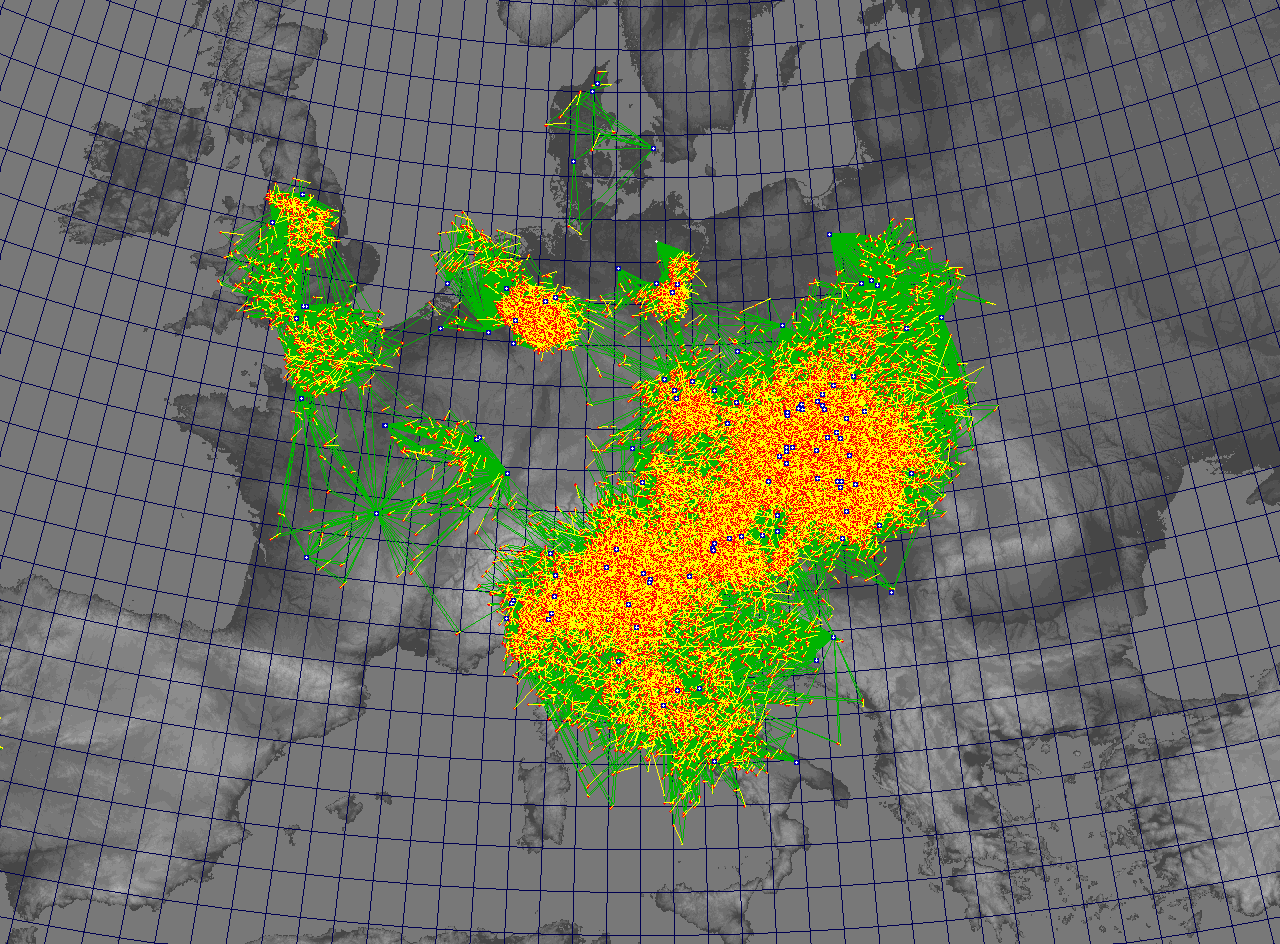 |
 |
U2_2012_EDM.zip | ||
| 2013 | 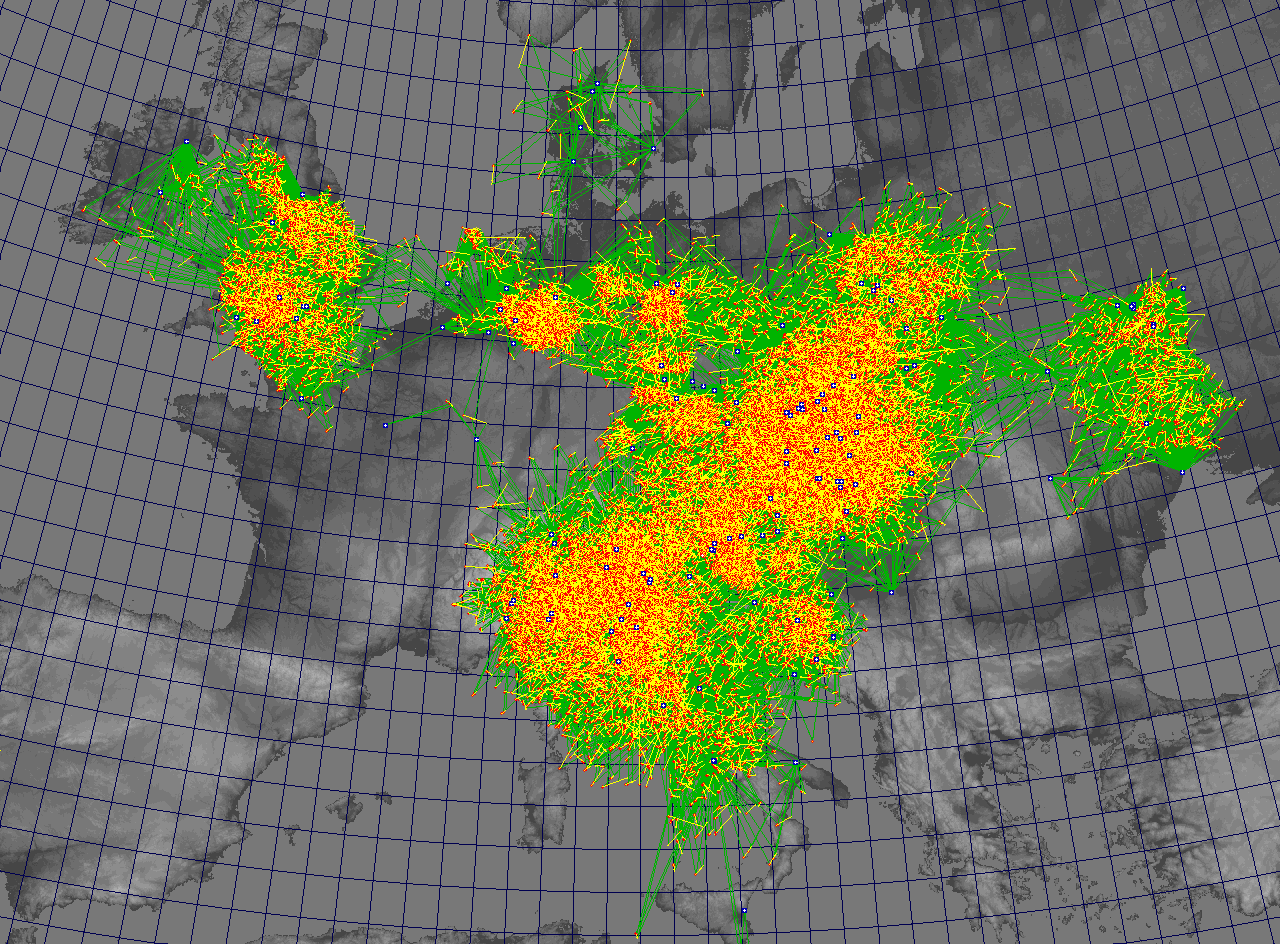 |
 |
 |
U2_2013_EDM.zip | |
| 2014 | 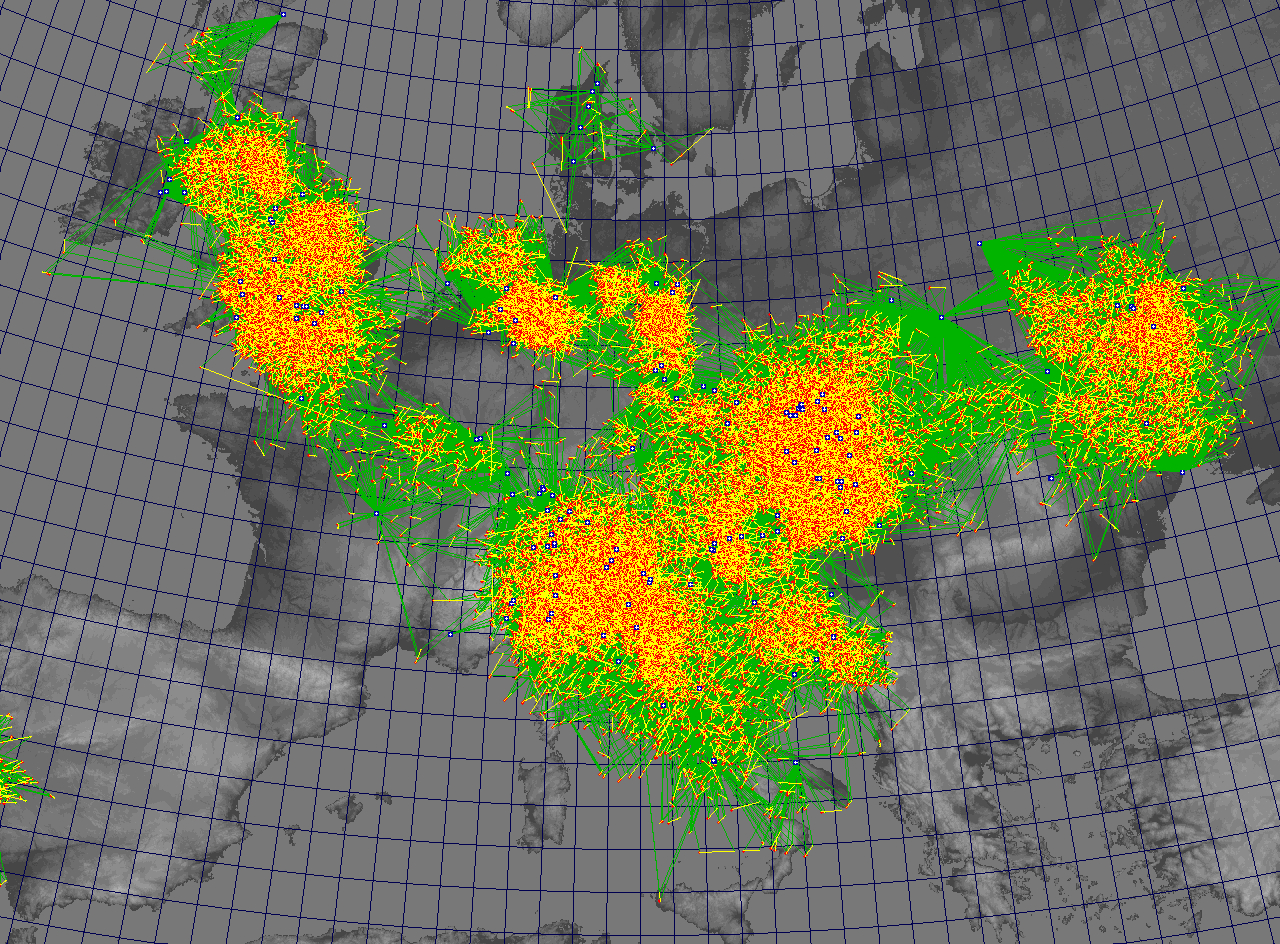 |
 |
 |
 |
U2_2014_EDM.zip |
| 2015 | 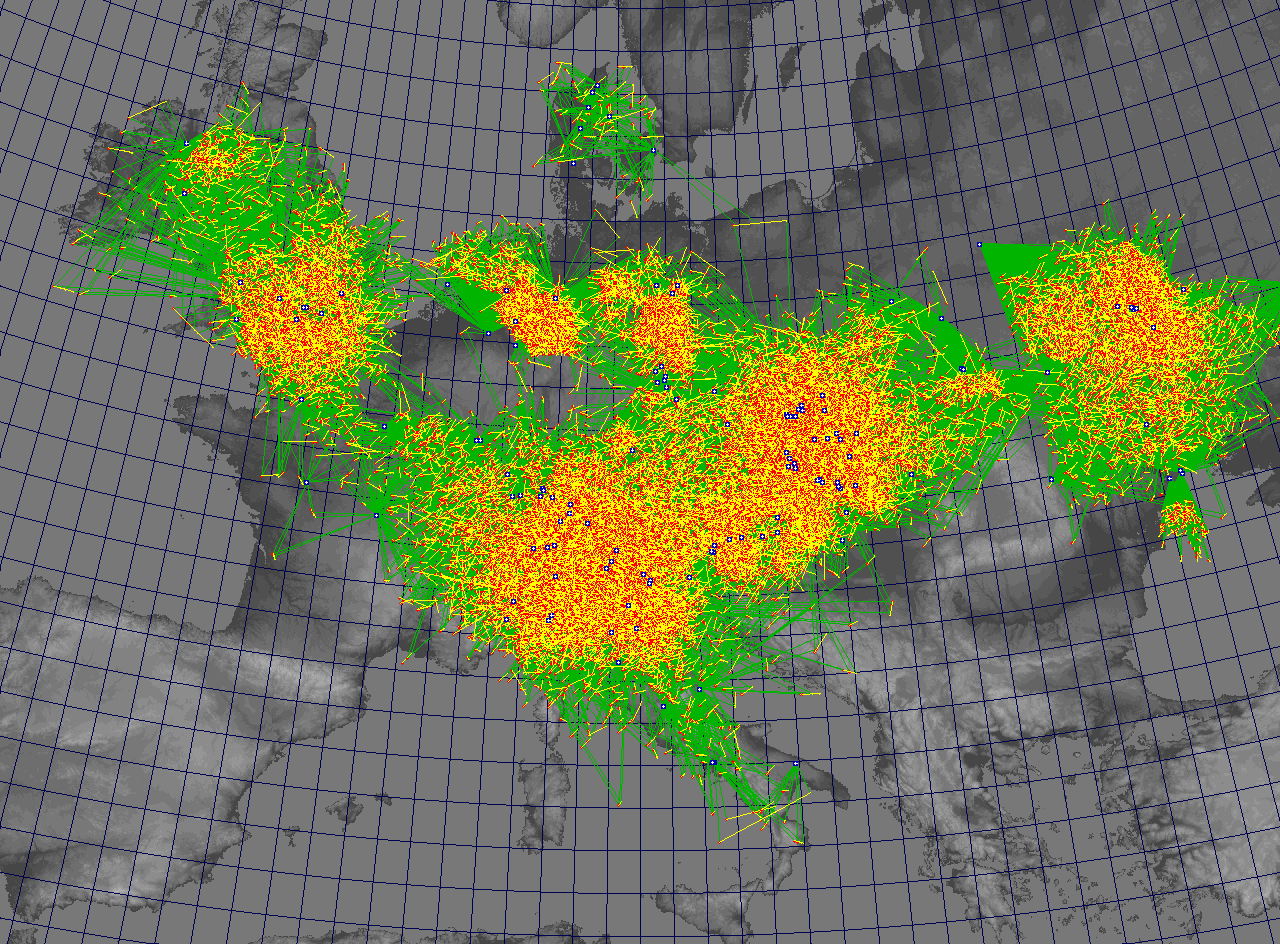 |
 |
 |
 |
U2_2015_EDM.zip |
| 2016 | 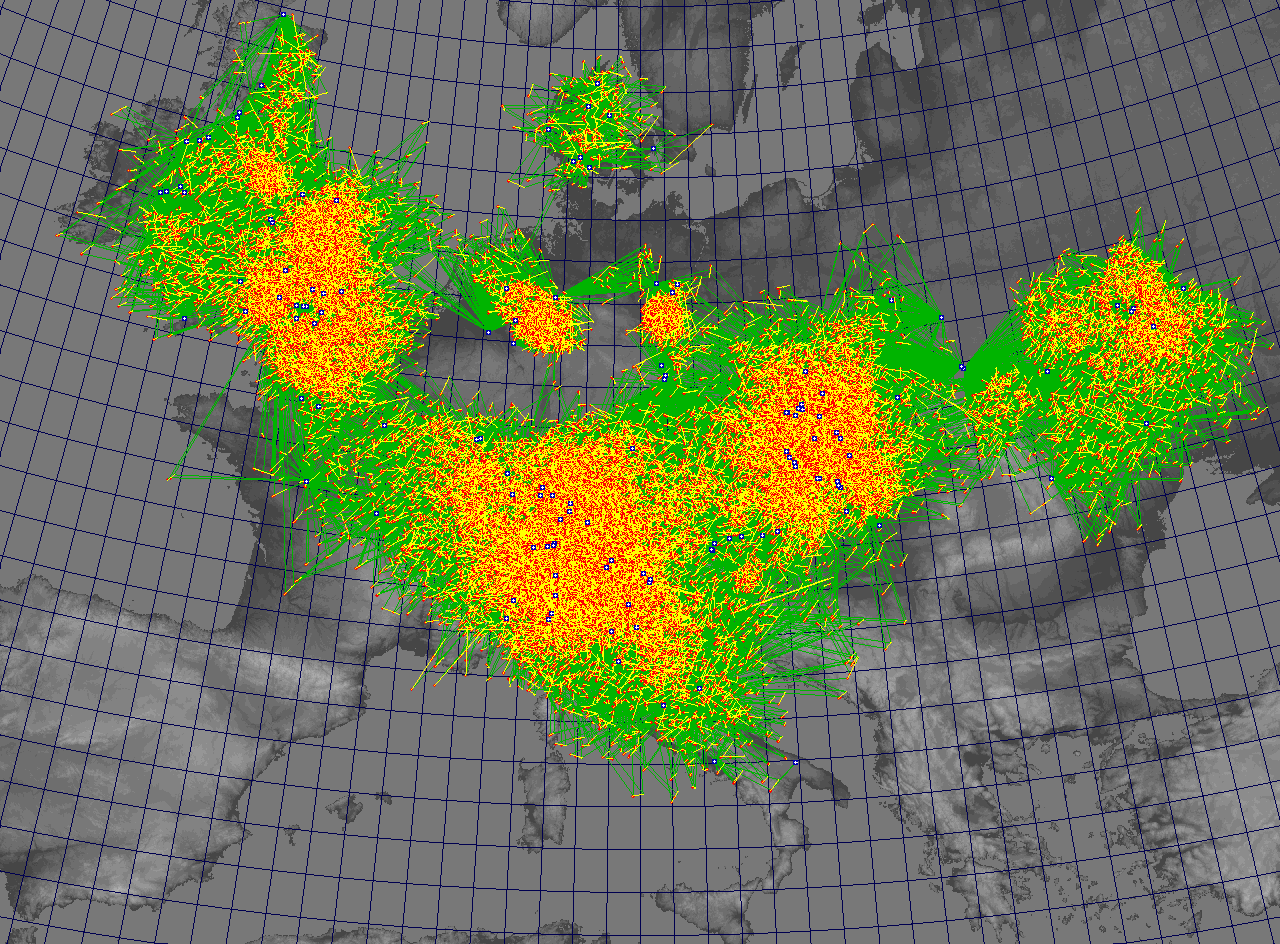 |
 |
 |
 |
U2_2016_EDM.zip |
| 2017 | 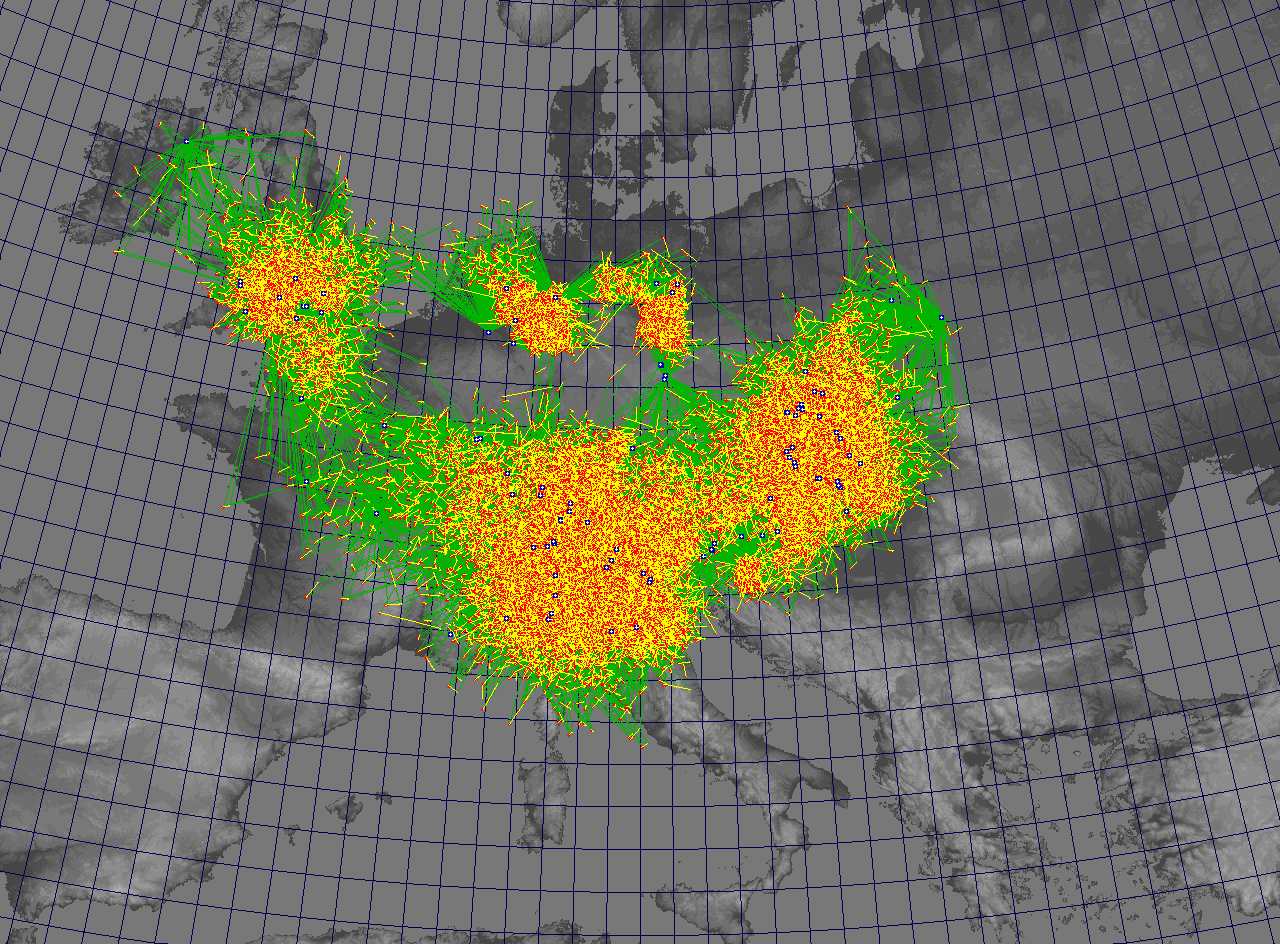 |
N/A | 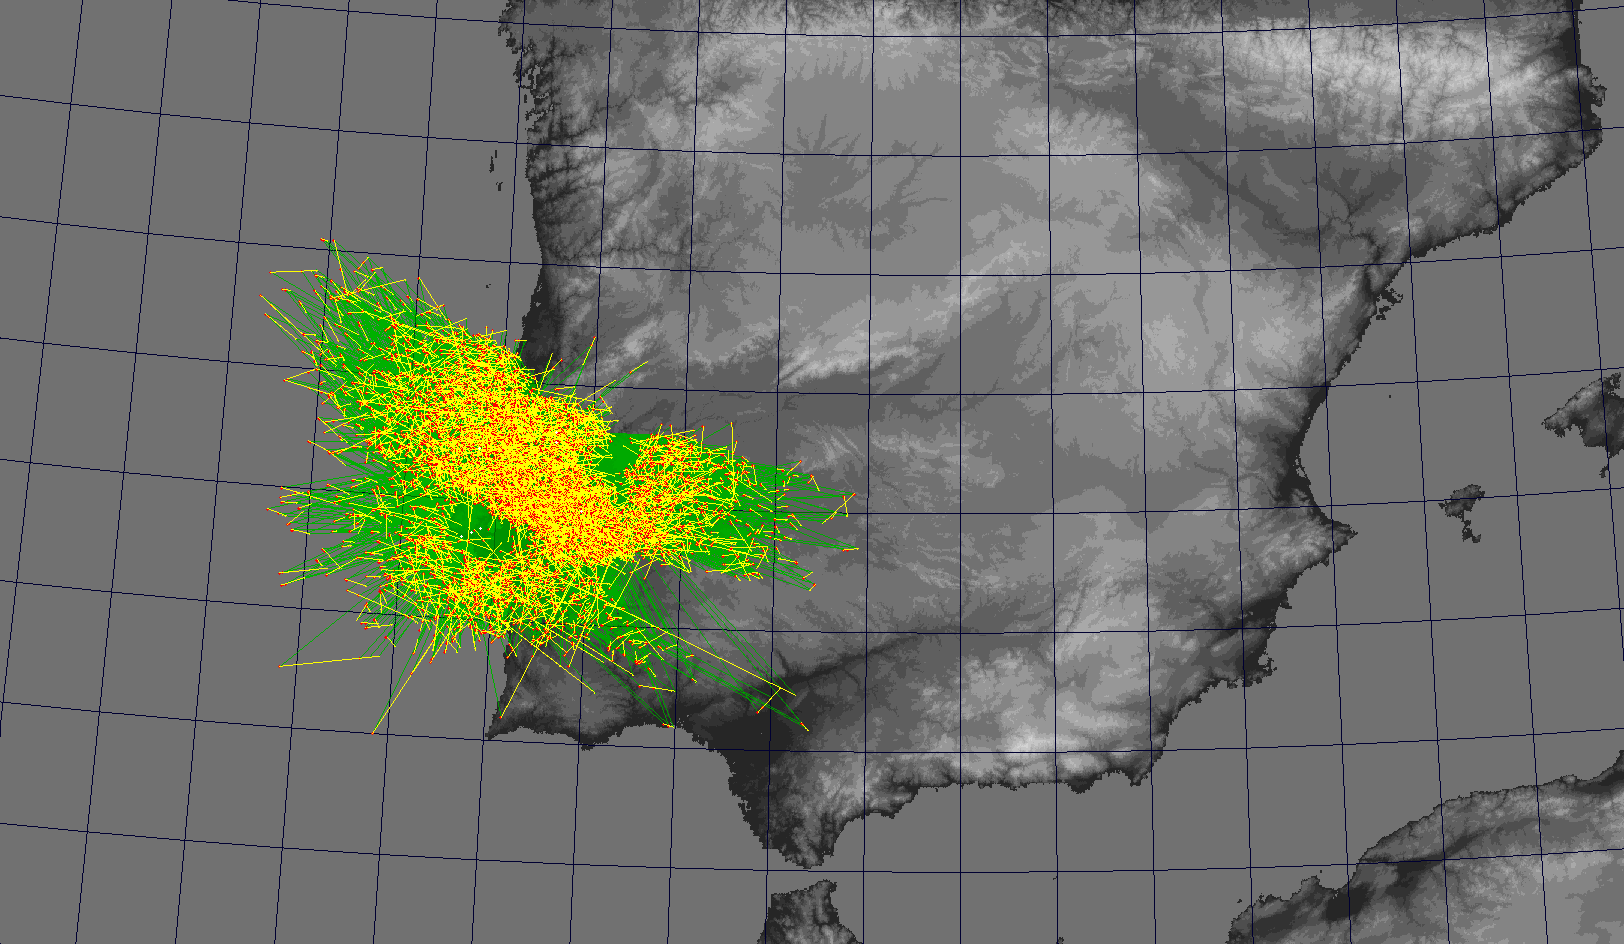 |
 |
U2_2017_EDM.zip |
| 2018 | 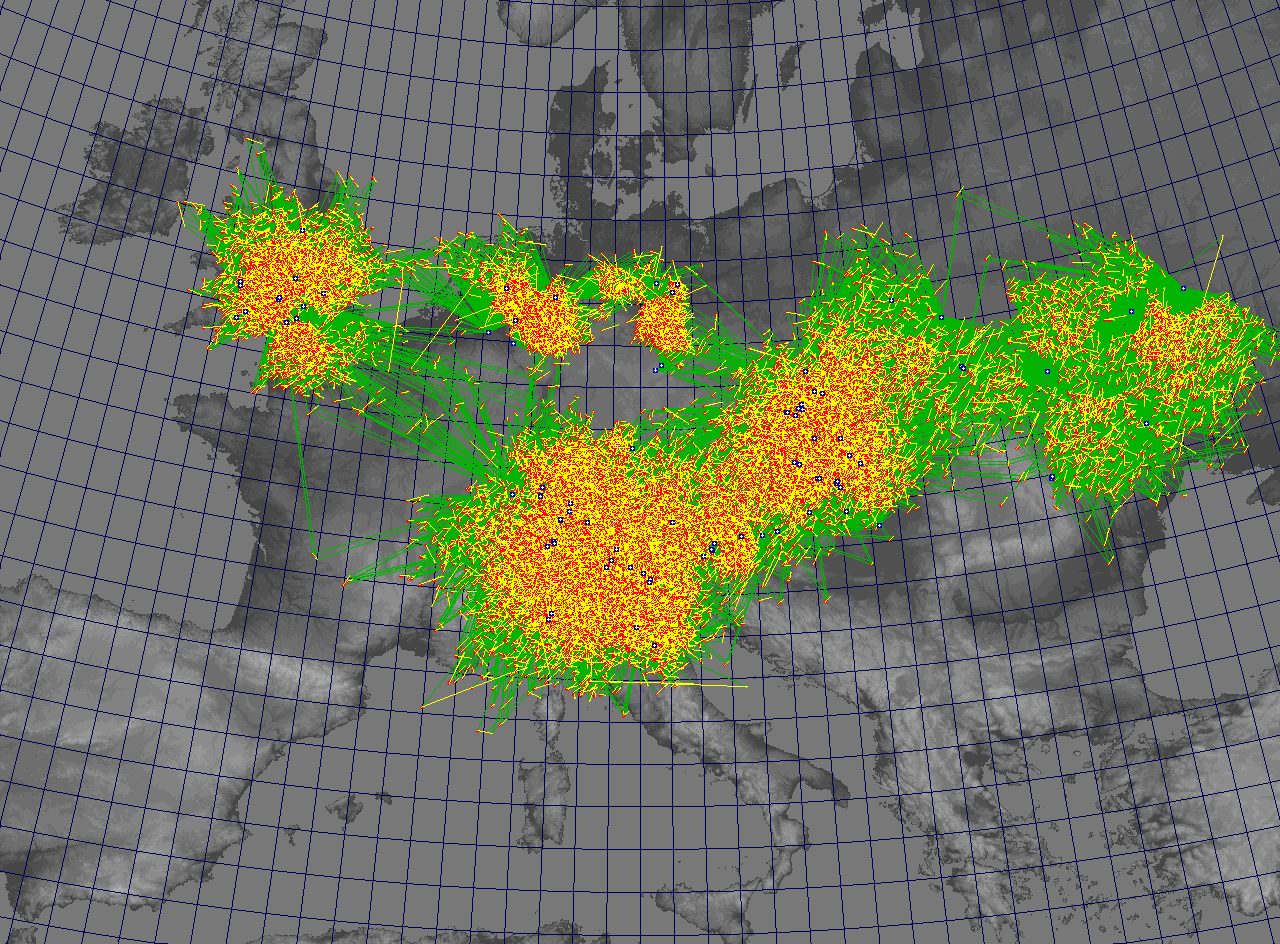 |
 |
 |
U2_2018_EDM.zip | |
| 2019 | 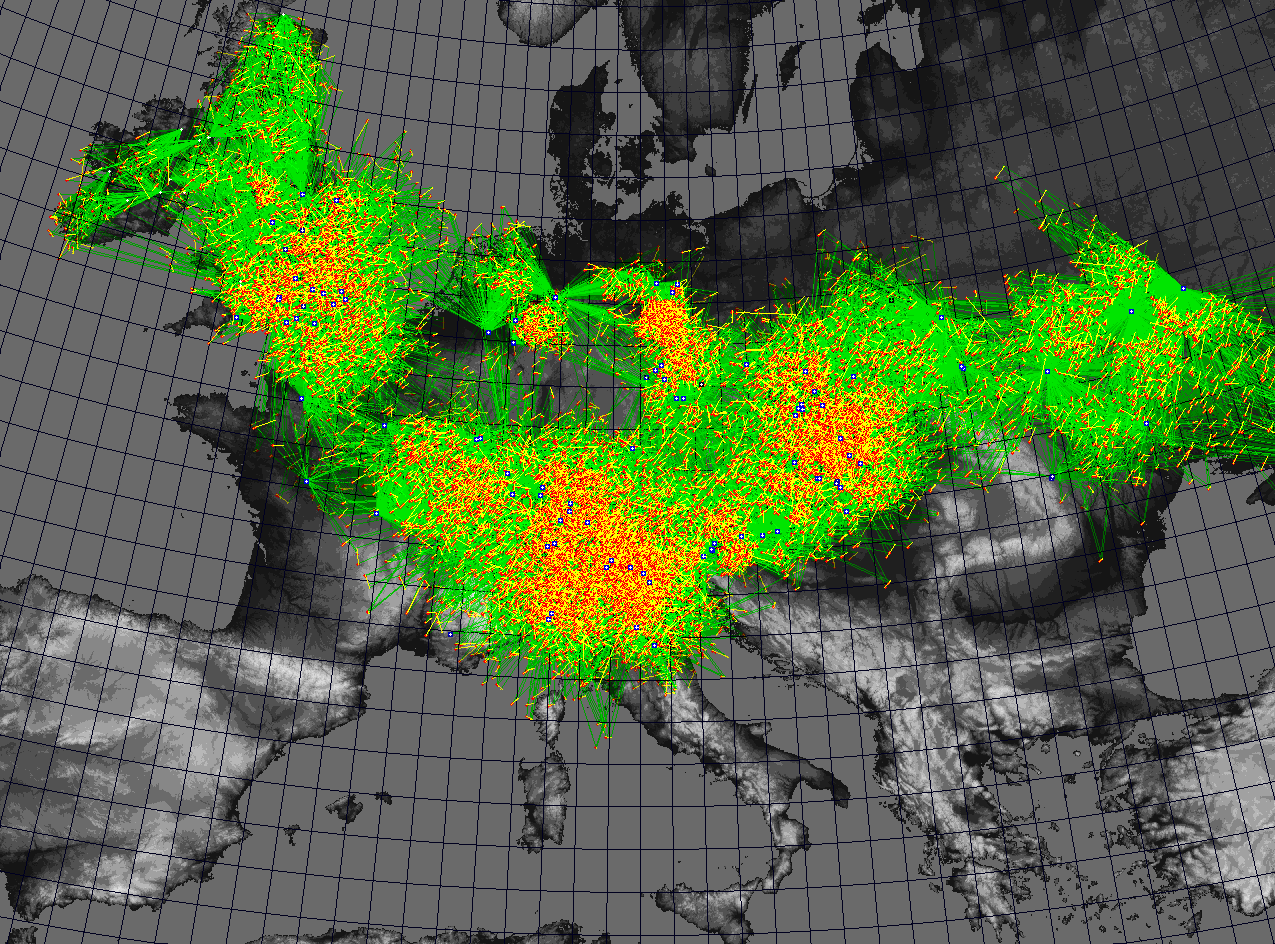 |
 |
 |
U2_2019_EDM.zip | |
| 2020 | 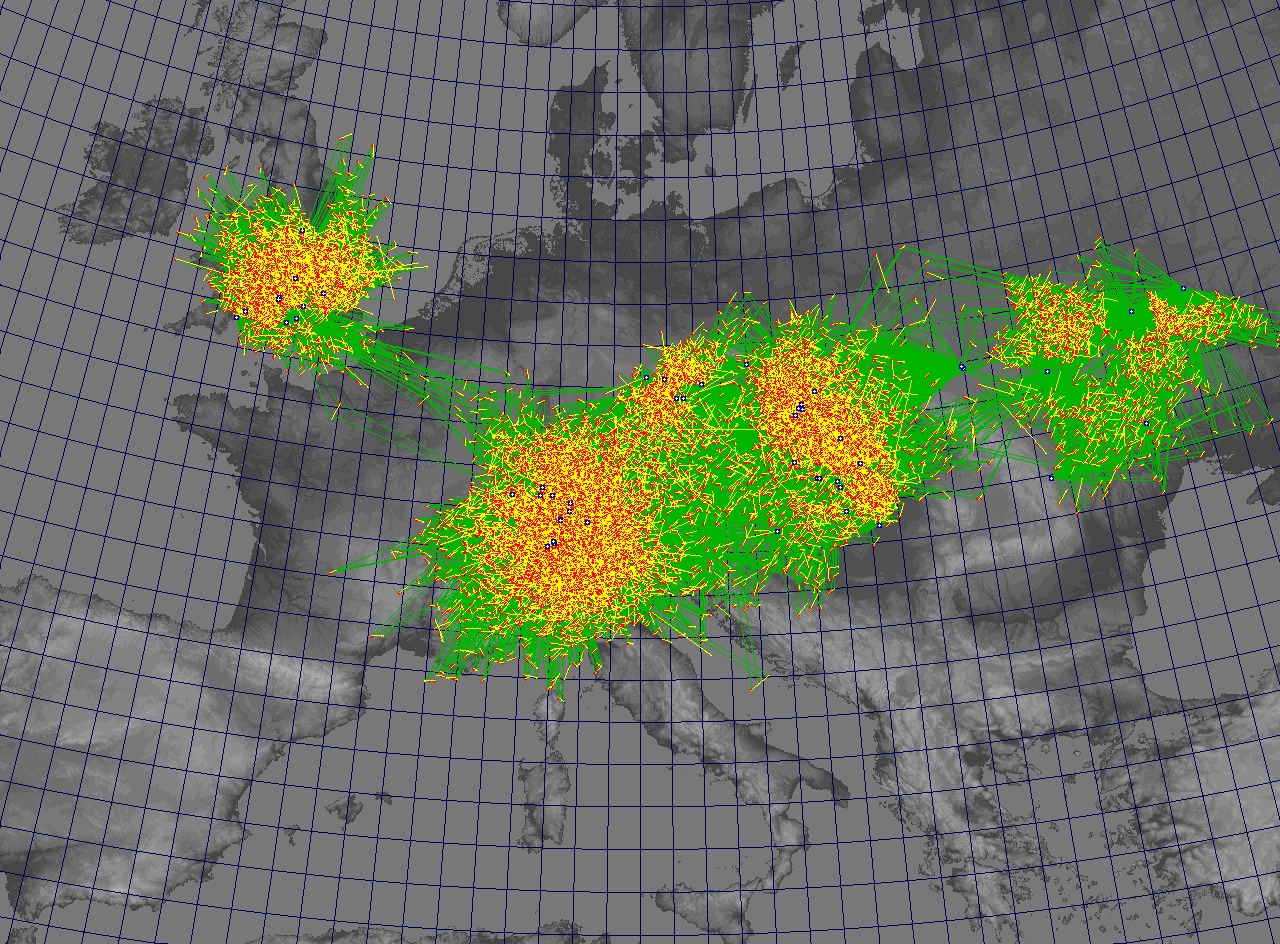 |
 |
U2_2020_EDM.zip | ||
| 2021 | 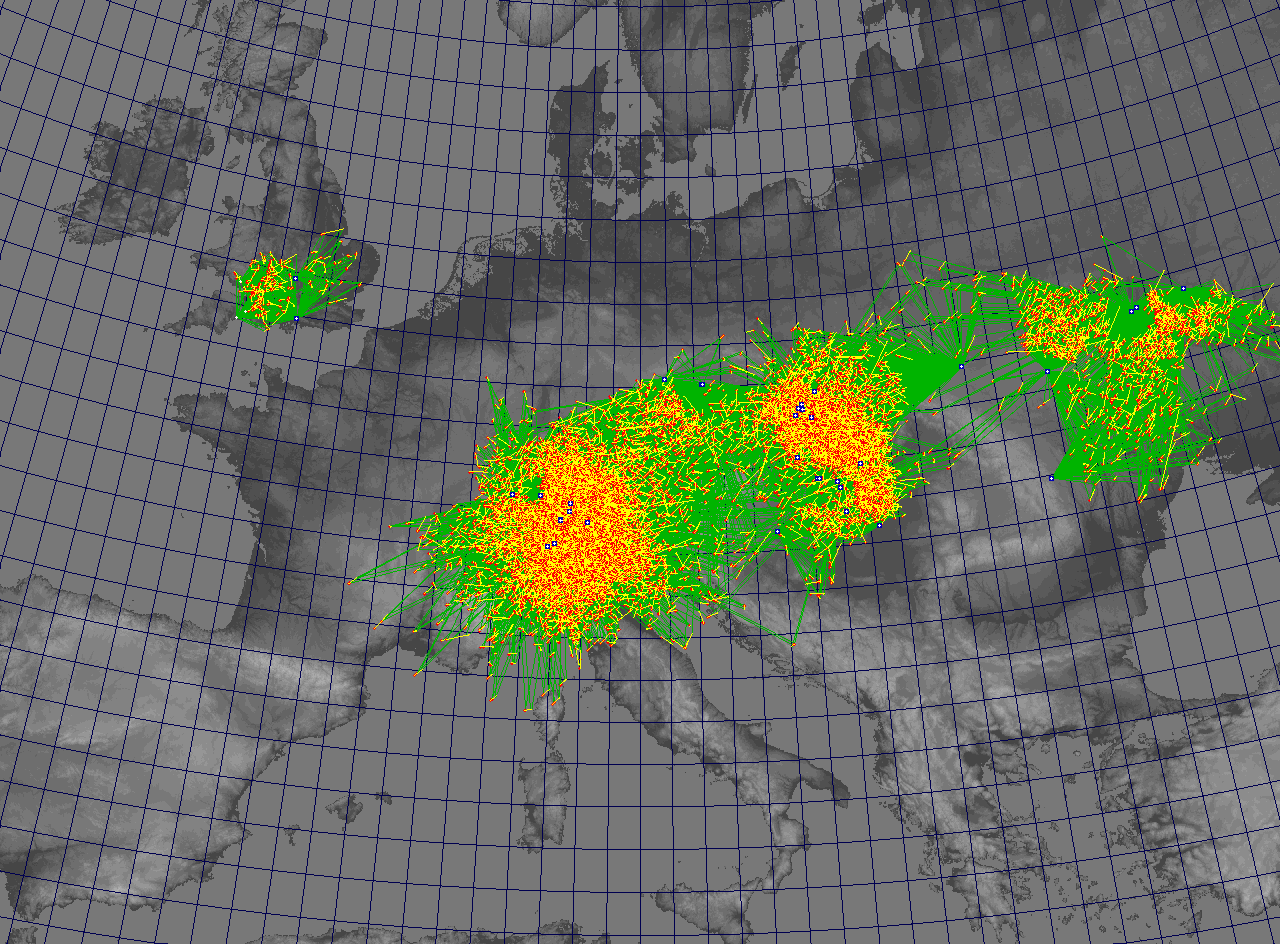 |
 |
U2_2021_EDM.zip | ||
| 2022 | 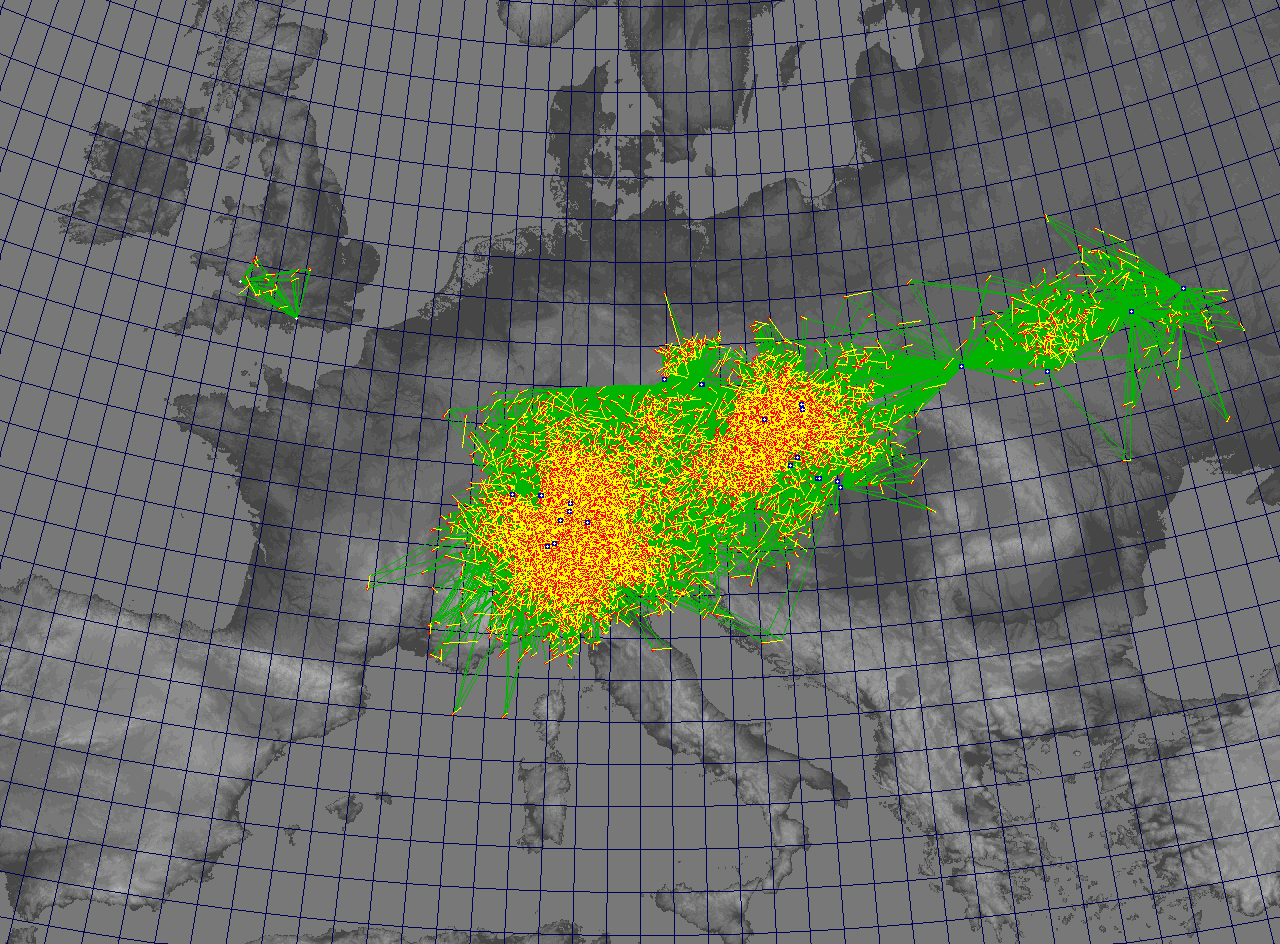 |
 |
U2_2022_EDM.zip | ||
| 2023 | 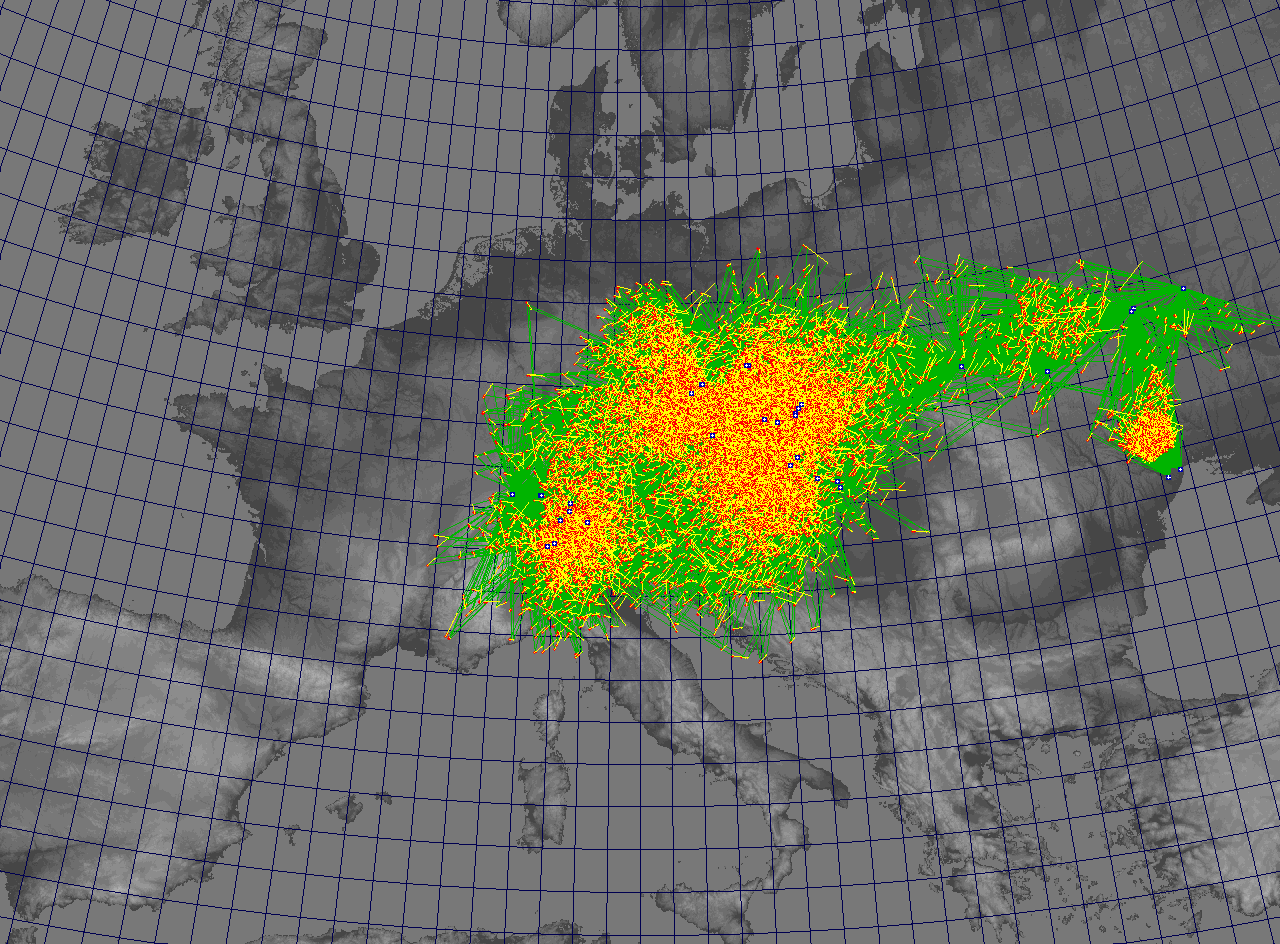 |
 |
U2_2023_EDM.zip | ||
| 2024 | 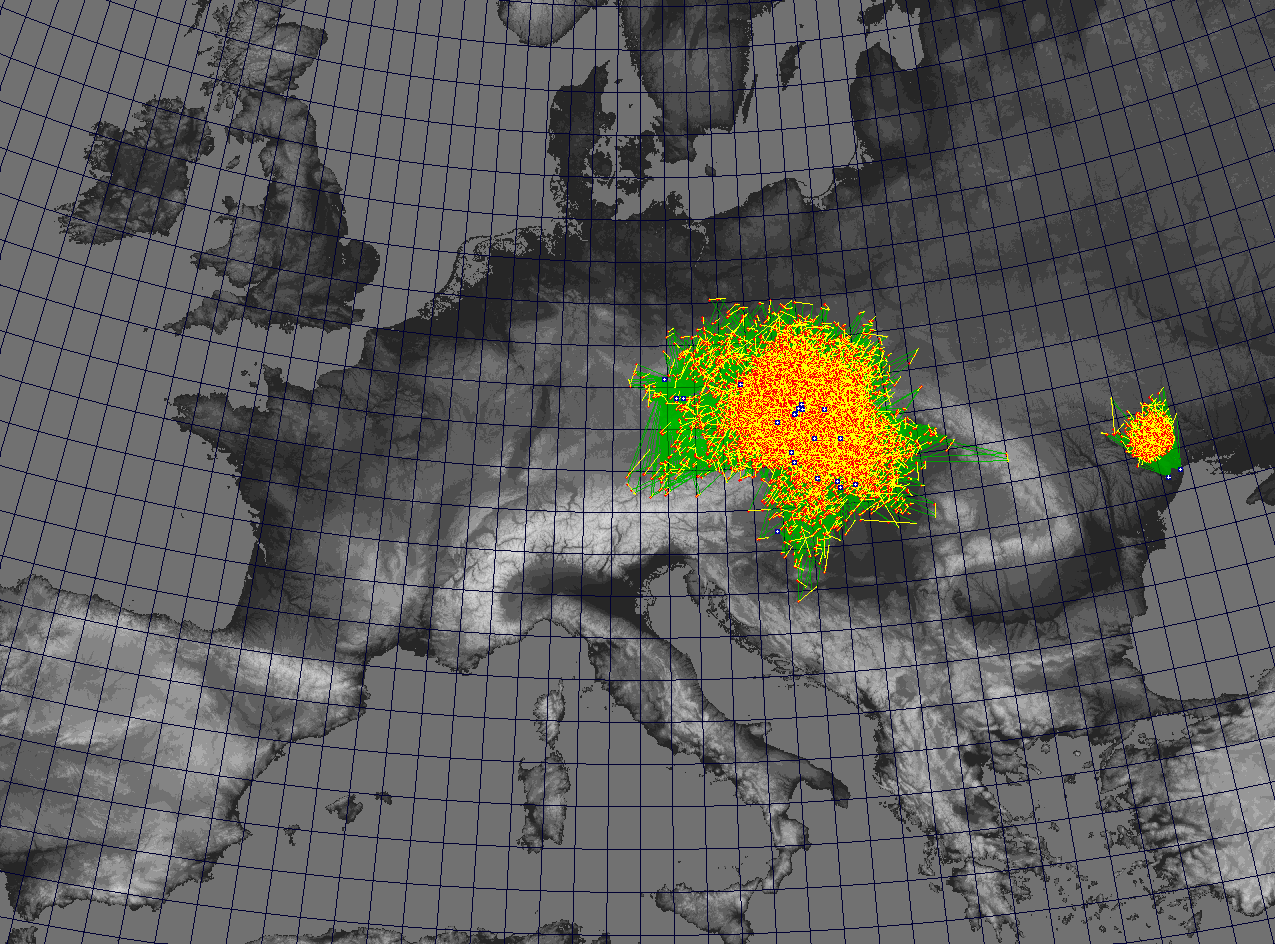 |
 |
U2_2024_EDM.zip |
Citations and References
EDMOND database can be downloaded and used freely. For the publishing of results using these data sets, please refer to the articles below:
Kornoš L., Koukal J., Piffl R., and Tóth J. (2013). Database of meteoroid orbits from several European video networks. Proceedings of the International Meteor Conference, La Palma, Sep. 20-23, 2012, eds. Gyssens M., Roggemans P., International Meteor Organization, p. 21-25.
Kornoš L., Koukal J., Piffl R., and Tóth J. (2014a). EDMOND Meteor Database. Proceedings of the International Meteor Conference, Poznań, Poland, Aug. 22-25, 2013, eds. Gyssens M., Roggemans P., International Meteor Organization, p. 23-25.
Kornoš L., Matlovič P., Rudawska R., Tóth J., Hajduková M. Jr., Koukal J., and Piffl R. (2014b). Confirmation and characterization of IAU temporary meteor showers in EDMOND database. Proceedings of the Meteoroids 2013 Conference, Aug. 26-30, 2013, A.M. University, Poznań, Poland, eds. Jopek T.J., Rietmeijer F.J.M., Watanabe J., Williams I.P., p. 225-233.